
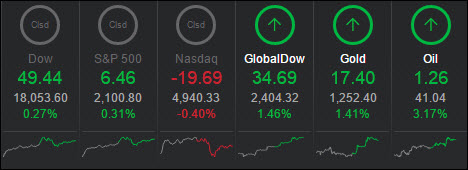
Mission Accomplished: S&P 2,100 And Dow 18,000

Ulli Market Commentary Contact

Tue pic

[Chart courtesy of MarketWatch.com]

1. Moving the Markets

Markets are feeling warm and fuzzy after returning to familiar 2015 stomping ground of 18,000 for the Dow and 2,100 for the S&P 500.

As was to be expected, some analysts are now even predicting that the Dow could climb to 18,700 over the next year and a half, largely driven by Goldman Sachs (GS), Apple (AAPL) and UnitedHealth (UNH). Yep, with the total disconnect of the market levels to underlying economic fundamentals, I won’t hold my breath for that to happen.

Crude oil prices advanced today as well, following a drop in the previous session despite a failure by oil-producing nations to agree on limiting output at a weekend meeting in Qatar. Analysts say oil is starting to lose its grip on the stock market as focus shifts back to first-quarter earnings season.

This afternoon we heard another lay-off story but this one was massive with Intel announcing that it was dismissing 11% of its entire workforce, or 12,000 people. I am sure that main stream media (MSM) can spin this into a positive for the economic recovery while the computer driven algos might use this headline to push the indexes to all-time highs.

I am being facetious, of course, but ZeroHedge commented this way:

Confused? Don’t be: it’s all part of the new normal recovery, and don’t forget the spin: don’t think of it as 12,000 highly paid engineers and tech workers fired, think of it as 12,000 brand spanking new waiters and bartenders.

For quite some time, I have been curious to see if there was any correlation between the events of 2008 and what we are experiencing in 2016. Today I lucked out and found this interesting S&P chart, also courtesy of ZeroHedge:

Read More

Dow Conquers 18,000 Level

Ulli Market Commentary Contact

Mon pic

[Chart courtesy of MarketWatch.com]

1. Moving the Markets

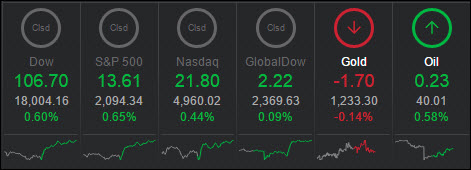
Despite yesterday’s miserable failure of the OPECers to come to a production limitation agreement, the markets headed north with the S&P climbing to a 4-month high while the Dow managed to close above the 18,000 level, its highest point since last July.

When news of the OPEC failure came out yesterday, oil crashed 7% in the futures market, but managed to rally 8% recovering all losses on… well… no real news other than the next set of speculation that China’s slowdown is easing while central banks are primed to push for more growth.

Helping equities was Fed Pres Dudley when he chimed in that “inflation will firm, and corporate earnings have so far largely topped sharply reduced estimates.” Sure, even JP Morgan’s 52% crash in earnings was good news, since it was better-than-expected.

Speaking of earnings, remember when they used to be the main item that determined stock prices? Well, no more, as this chart from ZeroHedge shows:

Read More

ETFs/Mutual Funds On The Cutline – Updated Through 04/15/2016

Ulli ETFs on the Cutline Contact

Below are the latest ETF Cutline reports, which show how far above or below their respective long-term trend lines (39 week SMA) my currently tracked ETFs/MFs are positioned.

The first report covers the ETF Master List from Thursday’s StatSheet and includes 381 ETFs, of which currently 283 (last week 218) are hovering in bullish territory.

The second report includes only High Volume ETFs. To clarify, High Volume (HV) ETFs are defined as those with an average daily volume of $10 million or higher. Volume figures can change in a hurry, so be sure to check first before investing.

These ETFs are generated from my selected list of 98 that I use in my advisor practice. It cuts out the “noise,” which simply means it eliminates those ETFs that I would never buy because of their volume limitations. 67 ETFs (last week 47) have managed to remain in bullish territory after the recent market volatility.

The third report covers Mutual Funds on the Cutline. There are currently 350 (last week 193) above the line and 430 below it out of the 780 that I follow.

Take a look:

  1. ETF Master Cutline Report
  2. ETF High Volume Cutline Report
  3. MF Cutline Report

In case you are not familiar with some of the terminology used in the reports, please read the Glossary of Terms.

If you missed the original post about the Cutline approach, you can read it here.

One Man’s Opinion: Is There A Disconnect Between GDP Readings And Retail Sales Numbers?

Ulli Market Review Contact

ManUS businesses are hiring people but are unable to get much extra output per hour of their work, and so income and sales are sluggish, said Vincent Reinhart of Standish Investment Management, a subsidiary of BNY Mellon.
While unemployment rate has hit 4.9-5 percent rate, the gross domestic product reading doesn’t seem to corroborate the US jobs scenario. Asked to explain, Vincent said all those people working need not necessarily feel good about it because they are not getting wage increases.

The national challenge is increasing productivity and the US administration has not been very successful about doing that in the last couple of years. Insofar as credibility of GDP numbers is concerned, undoubtedly the employment readings are more trustworthy since it’s possible to count the actual number of people with jobs.

Read More

New ETFs On The Block: First Trust Dorsey Wright Dynamic Focus 5 ETF (FVC)

Ulli Sector ETFs Contact

InvestingUsing the fund-of-funds investment strategy has proven quite successful for many US fund managers. First Trust Advisors, the Illinois-based seventh-largest issuer of exchange-traded funds, recently launched a dynamic version of its most popular sector-rotation ETF that can incorporate cash allocation during periods of heightened market volatility.
The First Trust Dorsey Wright Dynamic Focus 5 ETF (FVC) employs the same methodology as its highly successful $3.41 billion cousin – the First Trust Dorsey Wright Focus 5 ETF (FV), with the addition of a short-term cash-equivalent index. Since the launch of FV in 2014, First Trust has progressively expanded its offerings with momentum specialists Dorsey, Wright & Associates (DWA).

FVC tracks the performance of the Dorsey Wright Dynamic Focus Five Index – an innovative gauge developed and owned by DWA, the investment advisory firm that specializes in relative strength analysis and uses proprietary methodology to achieve investment outcomes.

Read More

ETF/No Load Fund Tracker Newsletter For April 15, 2016

Ulli ETF Tracker Contact

ETF/No Load Fund Tracker StatSheet

————————————————————-

https://theetfbully.com/2016/04/weekly-statsheet-for-the-etfno-load-fund-tracker-newsletter-updated-through-04142016/

————————————————————

Market Commentary

MARKETS POST GAINS FOR SECOND WEEK OF APRIL

Fri pic

[Chart courtesy of MarketWatch.com]

1. Moving the Markets

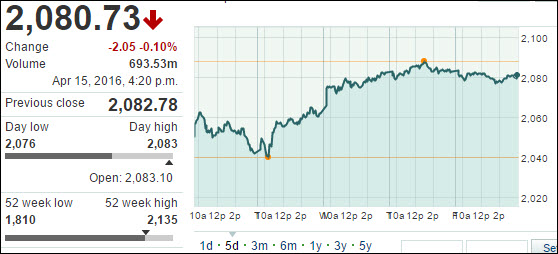
Although markets closed slightly lower on Friday, they remained in positive territory for the week. The 3-day rally from Tuesday to Thursday helped stocks continue on a bullish path.

We heard news from China today that the country’s first-quarter growth came in at 6.7%, which was pretty much in line with expectations. However, this is the country’s slowest pace of growth over the last seven years. Markets in China seemed to remain steady though after the news. The Shanghai composite fell just 0.13%.

While China’s numbers did not impress, most investors here are focusing more on the fact that the Dow is once again approaching the 18,000 mark. The index sits at 17,897 today. The last time the Dow touched the 18,000 mark was July of last year.  Breaking the mark once again could help catapult stocks forward despite absolutely horrific underlying economic data points ranging from a surge in inventory-to-sales, plunging industrial production and tumbling retail sales.

If that has you scratching your head, remember the current level and upward trajectory of the equity markets have absolutely nothing to do with economic reality; they are merely a function of the Fed’s dovish stance on interest rates.

Read More