Do you want to know which ETFs are hot and which ones are not? Then you need my High-Volume ETF Cutline report. It tells you how close or far each of the 311 ETFs I follow is from its long-term trend line (39-week SMA). These are the ETFs that trade more than $5 million a day, so they are not some obscure funds that nobody cares about.
The report is split into two parts: The winners that are above their trend line (%M/A), and the losers that are below it. The yellow line is the line of shame that separates them. You can see how many ETFs are in each group and how they have changed since the last report (213 vs. 217 current).
JULY’S FINAL LESSON: EARNINGS IMPRESS, BONDS STILL MATTER
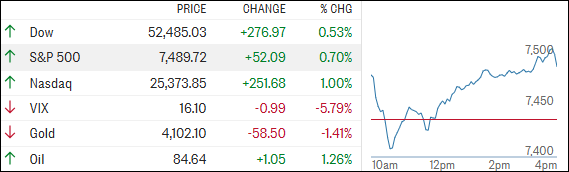
[Chart courtesy of MarketWatch.com]
Moving the market
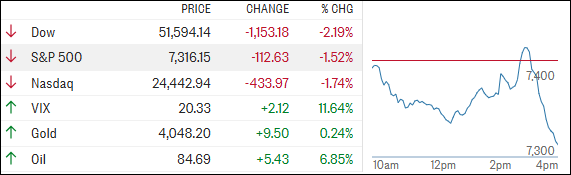
If we were chatting over coffee this morning, I’d say the market’s main message was simple: earnings are still driving the bus, but interest rates keep grabbing the steering wheel.
Stocks spent Friday bouncing between gains and losses as investors weighed strong results from the tech heavyweights against another surge in bond yields.
Apple’s earnings were solid, but not solid enough for Wall Street’s liking, sending the stock sharply lower. Amazon and Microsoft, on the other hand, reminded investors why AI remains the market’s favorite story, helping fuel a late-session recovery.
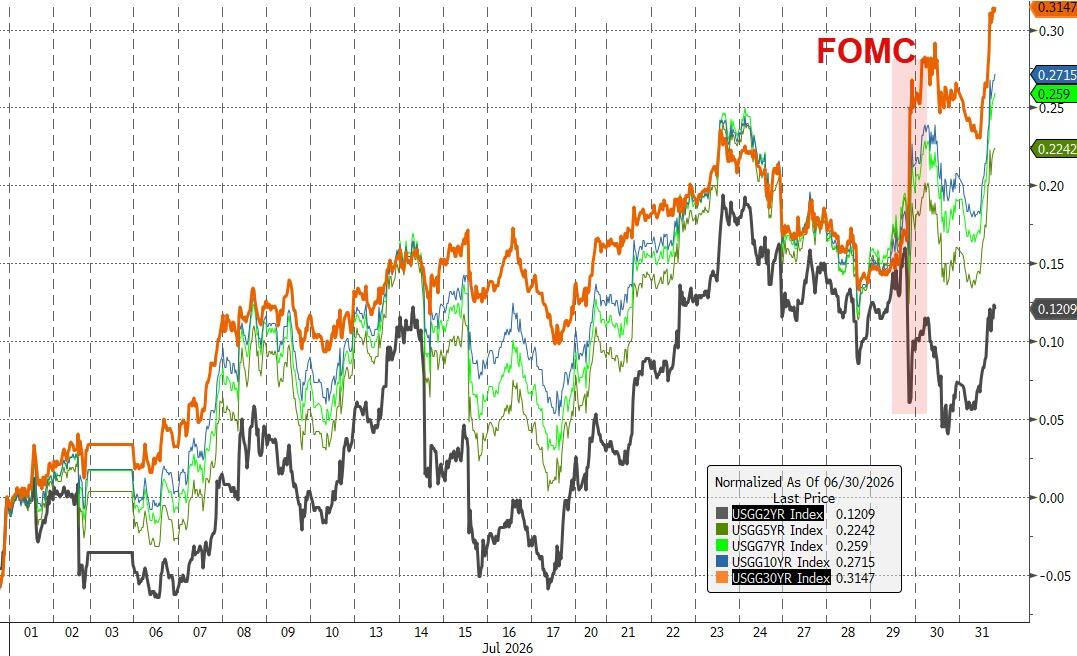
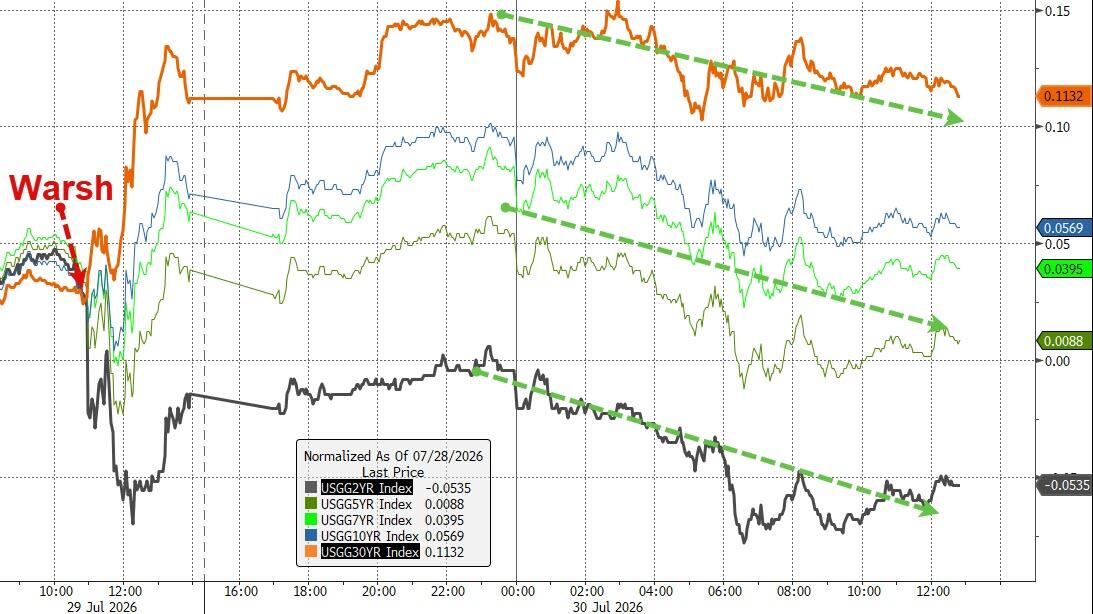
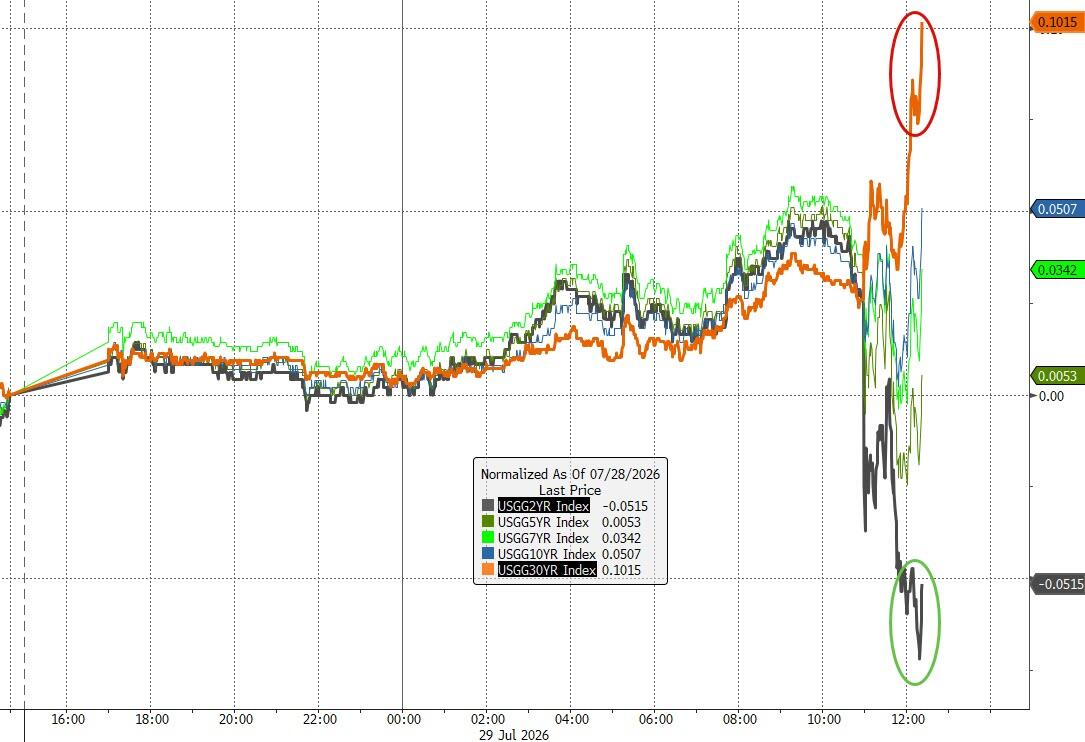
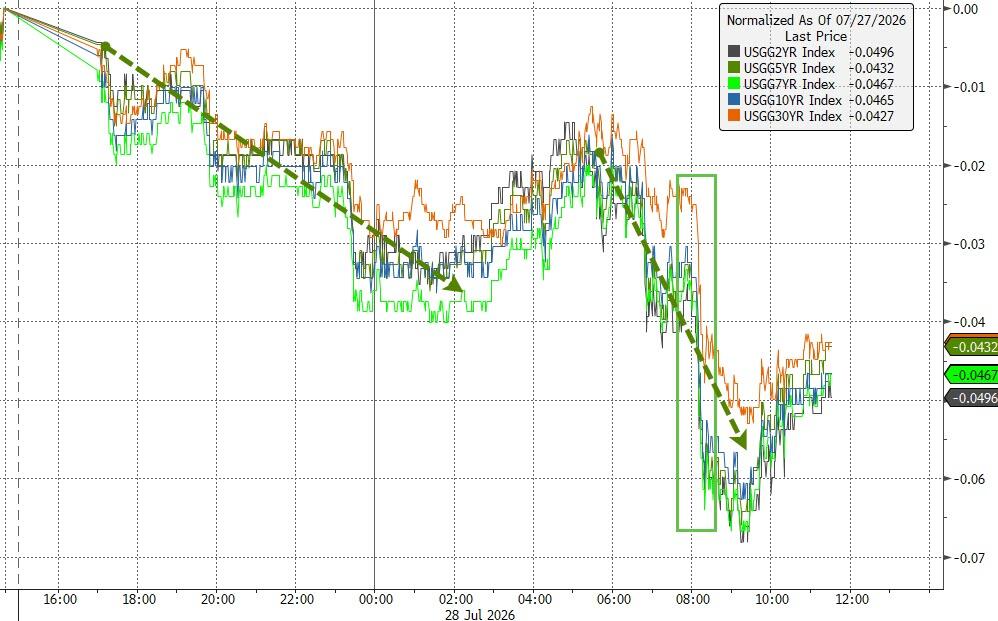
The bigger development, however, may have been the bond market. Long-term Treasury yields climbed to levels not seen since 2007, reflecting growing concerns that inflation may prove more stubborn than hoped. As one Fed official essentially admitted, there is no magic wand. Traders seem to be taking him at his word.
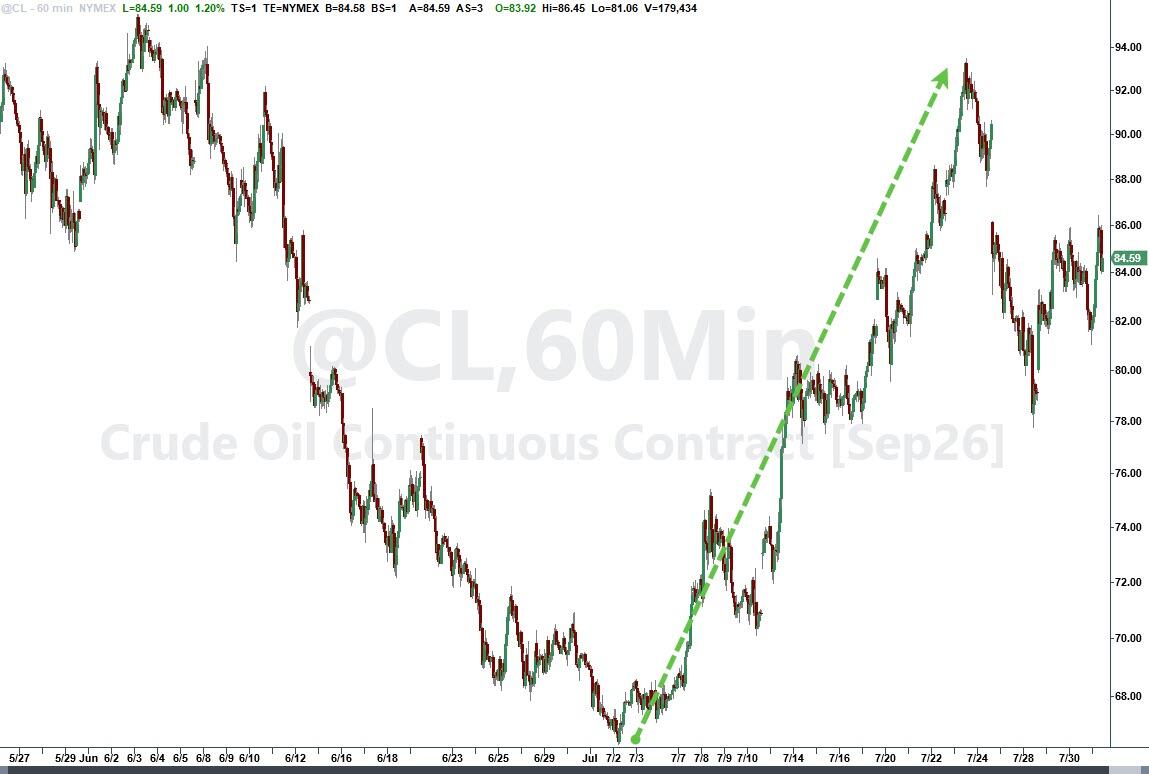
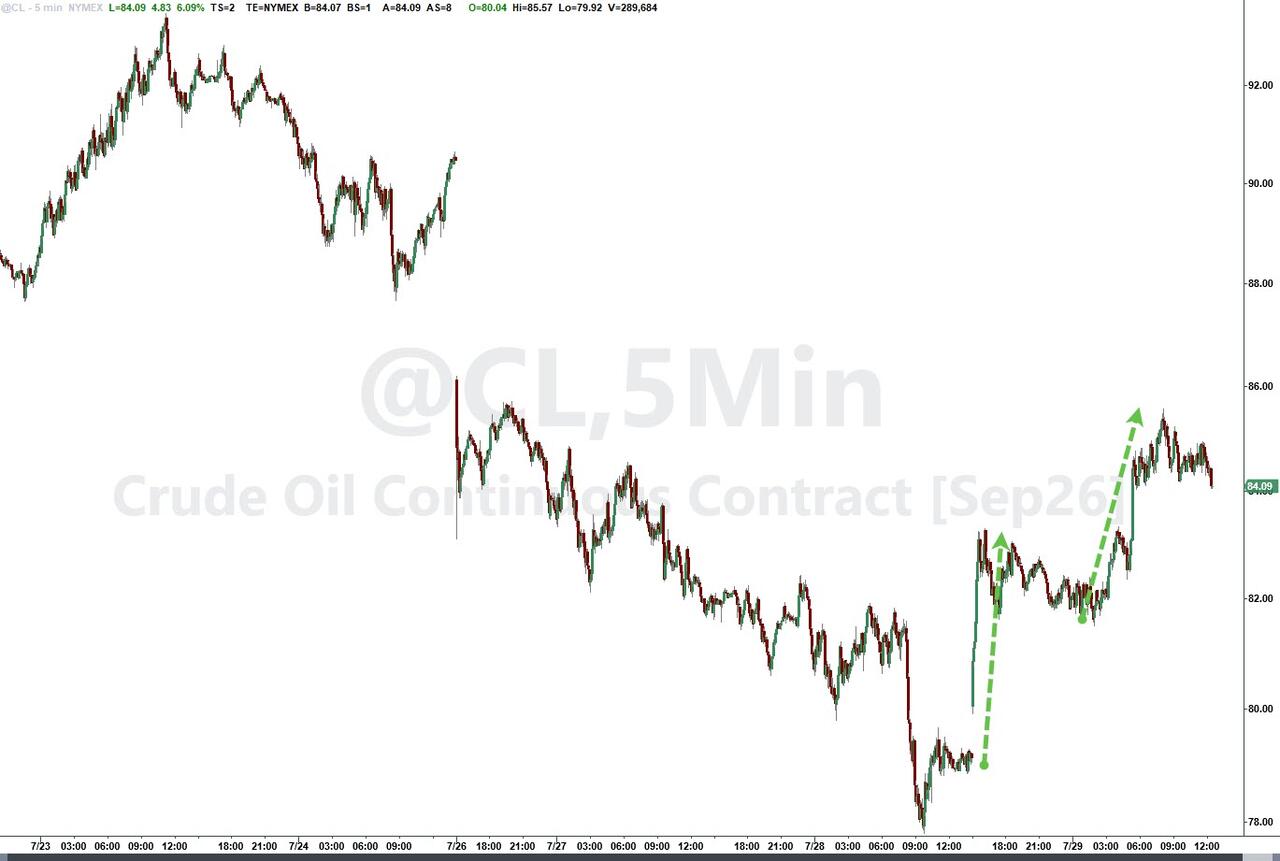
Looking back, July was a month many investors won’t miss. The Nasdaq suffered its worst July in more than two decades, bond yields posted their biggest July jump since 2005, and oil surged more than 20%, its strongest July in over 30 years.
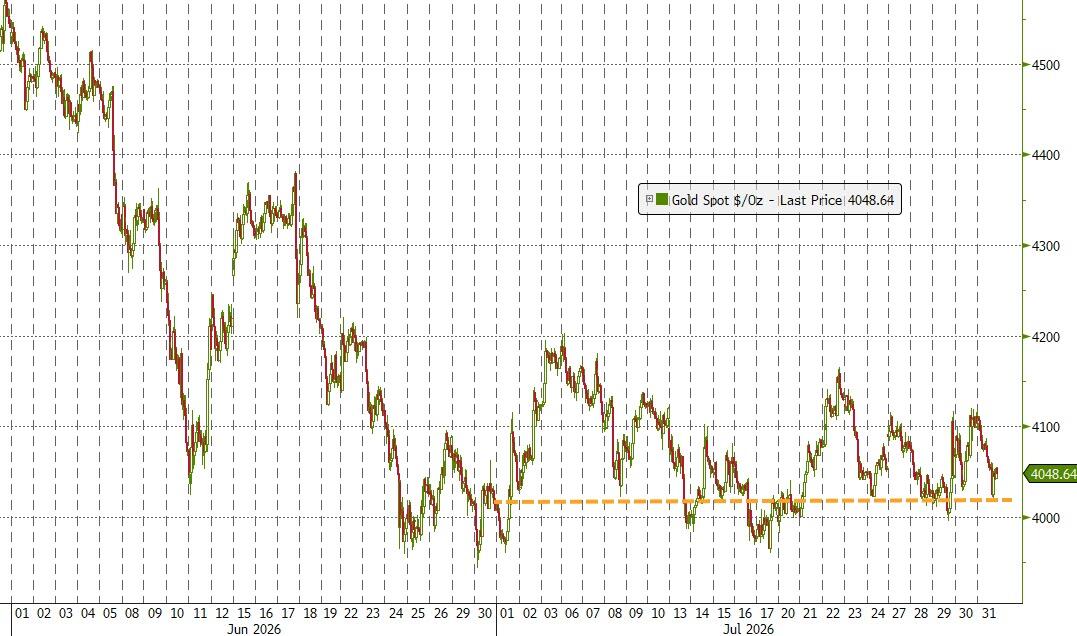
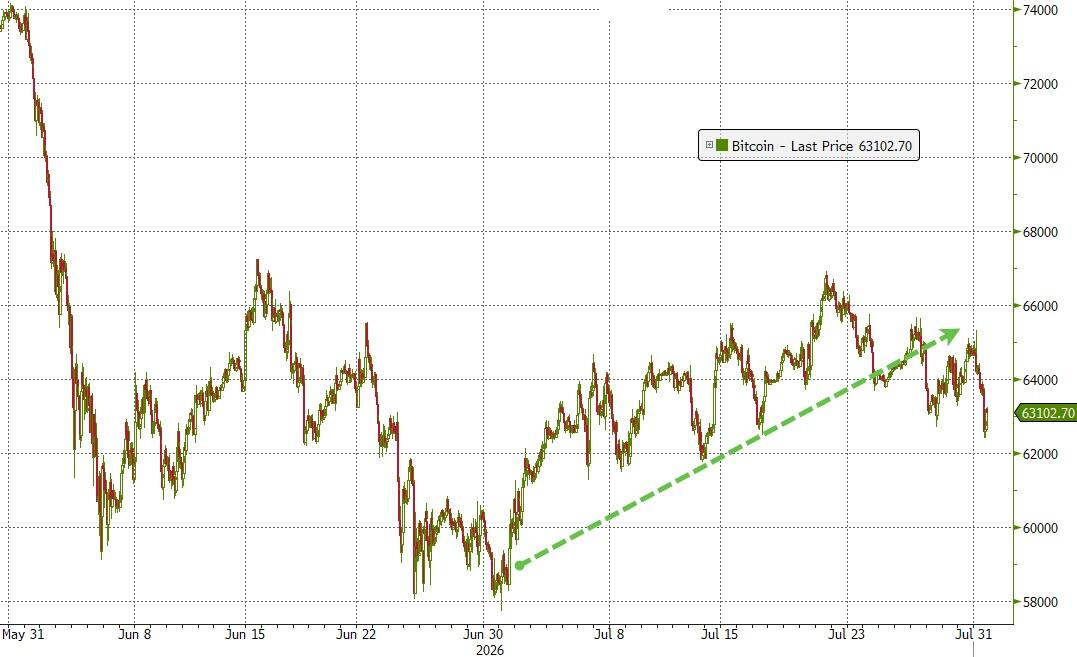
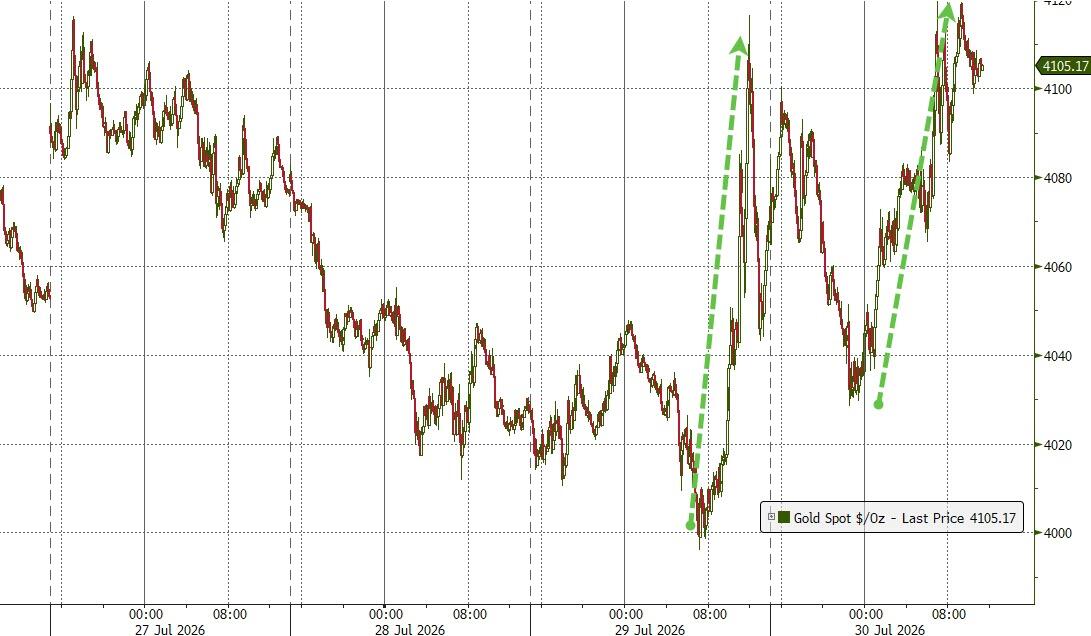
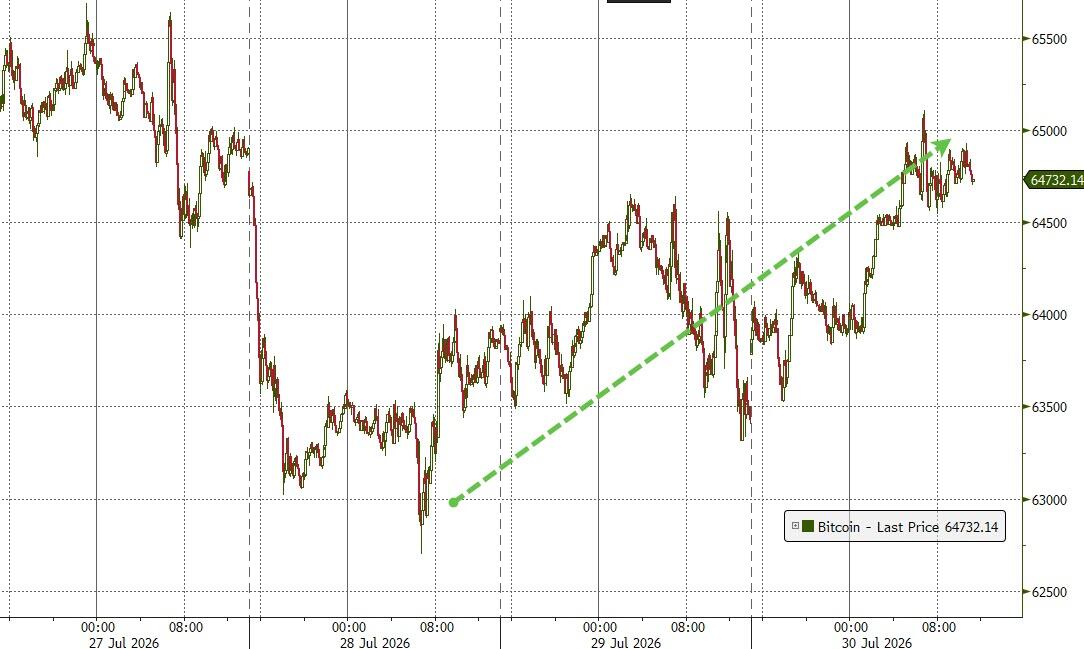
Meanwhile, gold and Bitcoin spent much of the month running in place, and central banks added plenty of uncertainty while offering very few clear answers.
In the end, July was a reminder that markets can change their obsession faster than a toddler picks a favorite toy. One day it’s AI, the next it’s inflation, then rates, oil, or the economy.
The question now is whether August brings some clarity… or just a fresh set of headlines to worry about. It’s wide open as to what Mr. Market will be obsessing over next month.
Out of the 1,800+ ETFs out there, I only pick the ones that trade over $5 million per day (HV ETFs), so you don’t get stuck with a lemon that nobody wants to buy or sell.
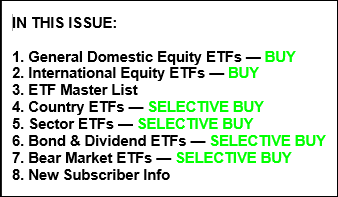
Trend Tracking Indexes (TTIs)
These are the main indicators that tell you when to buy or sell Domestic and International ETFs (section 1 and 2). They do that by comparing their position to their long-term M/A (Moving Average). If they cross above, and stay there, it’s a green light to buy. If they fall below, and keep going, it’s a red light to sell. And to make sure you don’t lose your shirt if things go south, I also use a 12% trailing stop loss on all positions in these categories.
All other investment areas don’t have a TTI and should be traded based on the position of each ETF relative to its own trend line (%M/A). That’s why I call them “Selective Buy.” In other words, if an ETF goes above its own trend line, you can buy it. But don’t forget to use a trailing sell stop of 12%, or less if you’re feeling nervous.
If some of these words sound like Greek to you, please check out the Glossary of Terms and new subscriber information in section 9.
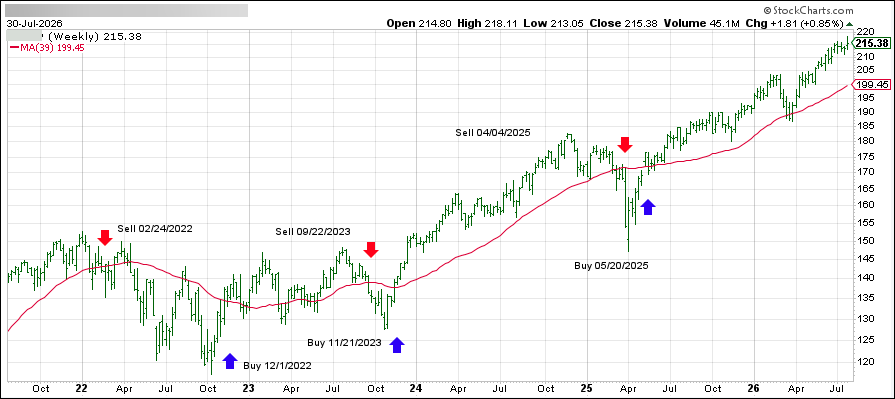
DOMESTIC EQUITY ETFs: BUY— effective 5/20/2025
Click on chart to enlarge
This is our main compass, the Domestic Trend Tracking Index (TTI-green line in the above chart). It has broken above its long-term trend line (red) by +8.40% and remains in “Buy” mode, with our holdings being subject to our trailing sell stops.
It looked like the market served up a classic reminder that investors have a short memory when there’s good news on the table.
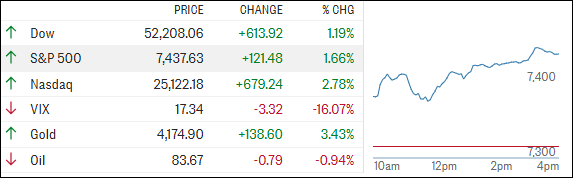
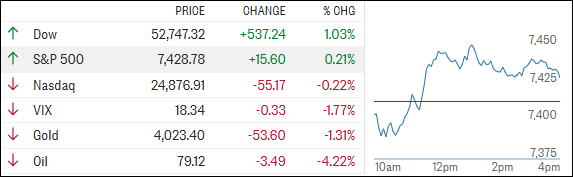
After yesterday’s Fed-induced selloff, stocks came roaring back, led by Microsoft, whose Azure-fueled earnings report had investors reaching for a second helping. Semiconductor stocks happily joined the feast, turning AI optimism back into the market’s favorite flavor.
Not everyone got an invitation. Meta stumbled after a disappointing outlook and shrinking free cash flow, highlighting that Wall Street still expects AI spending to come with a clear path to profits.
As one trader joked, there seems to be a difference between “investing in the future” and “sending the future an unlimited budget.”
Elsewhere, inflation remained sticky, economic growth cooled a bit, and yet lower oil prices and falling bond yields gave stocks all the encouragement they needed.
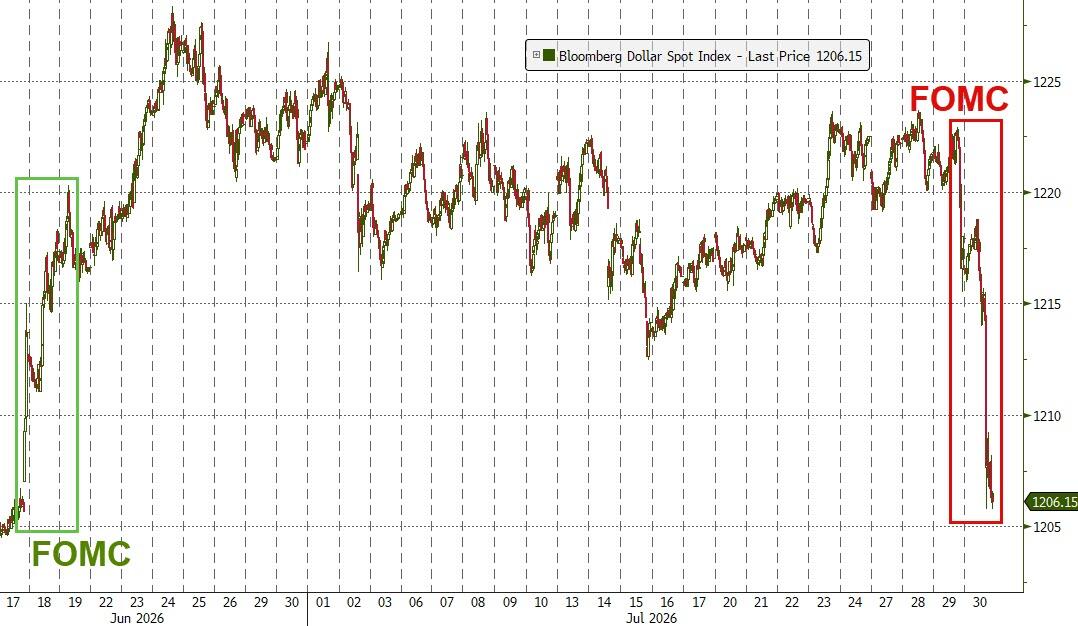
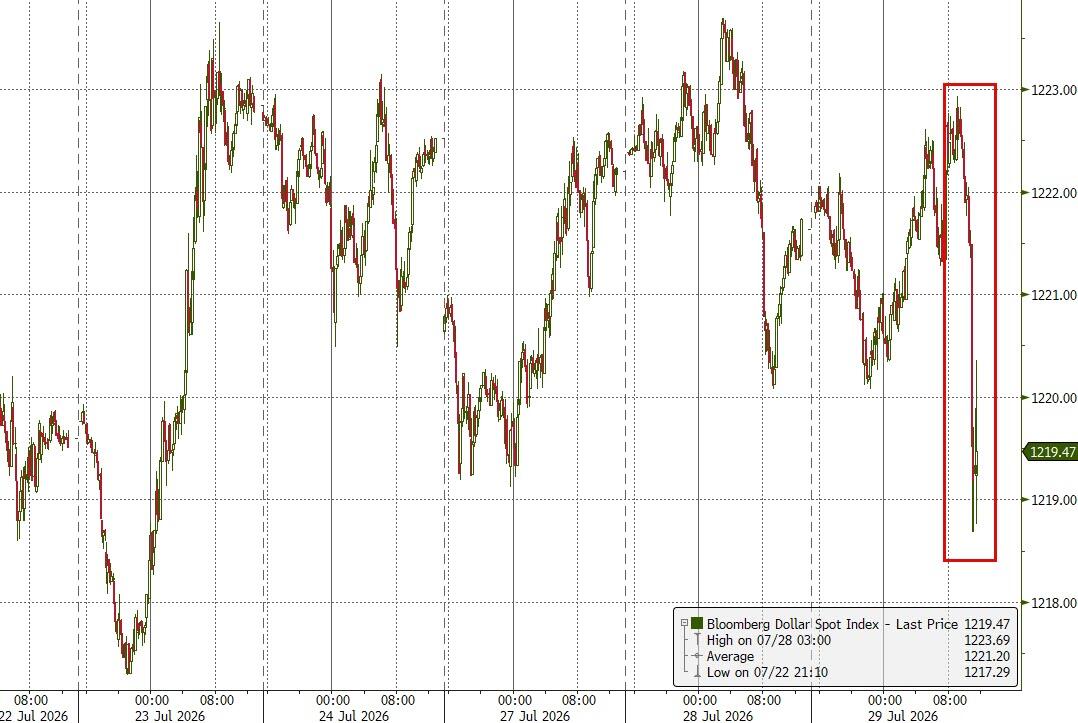
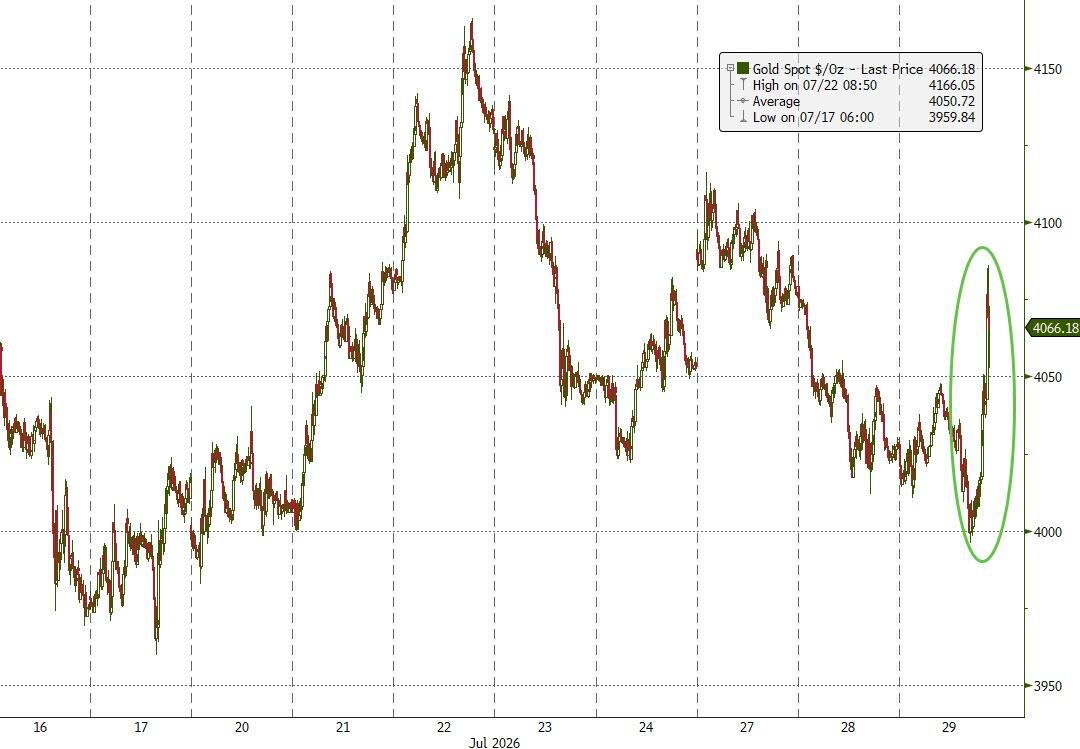
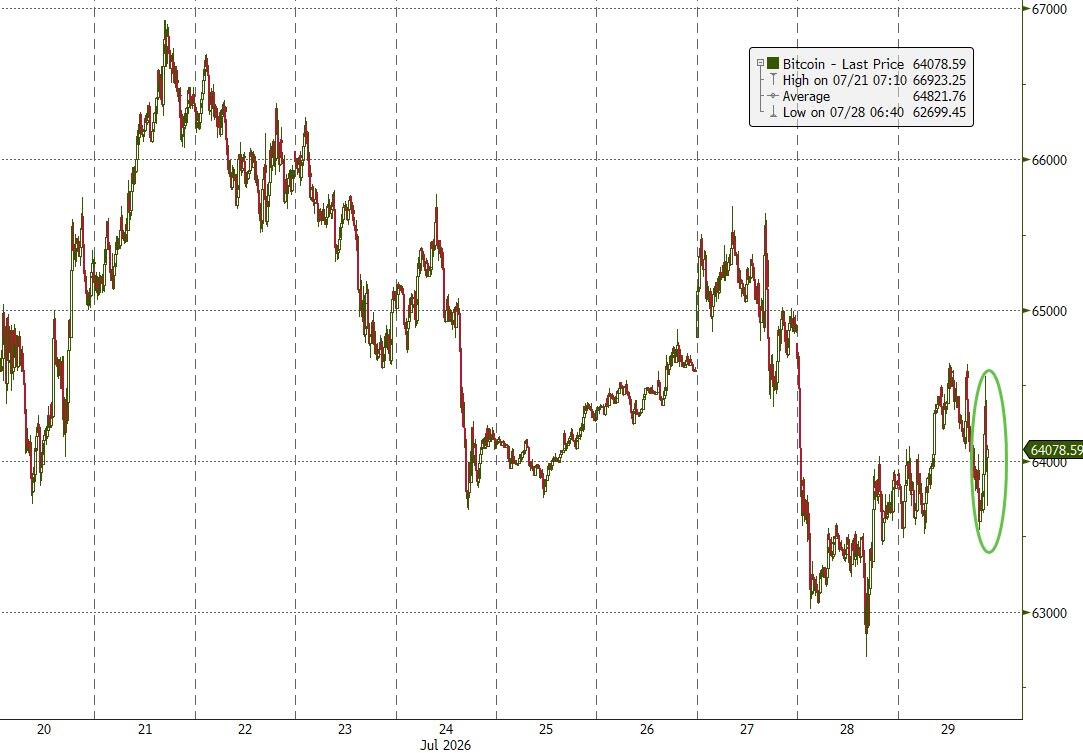
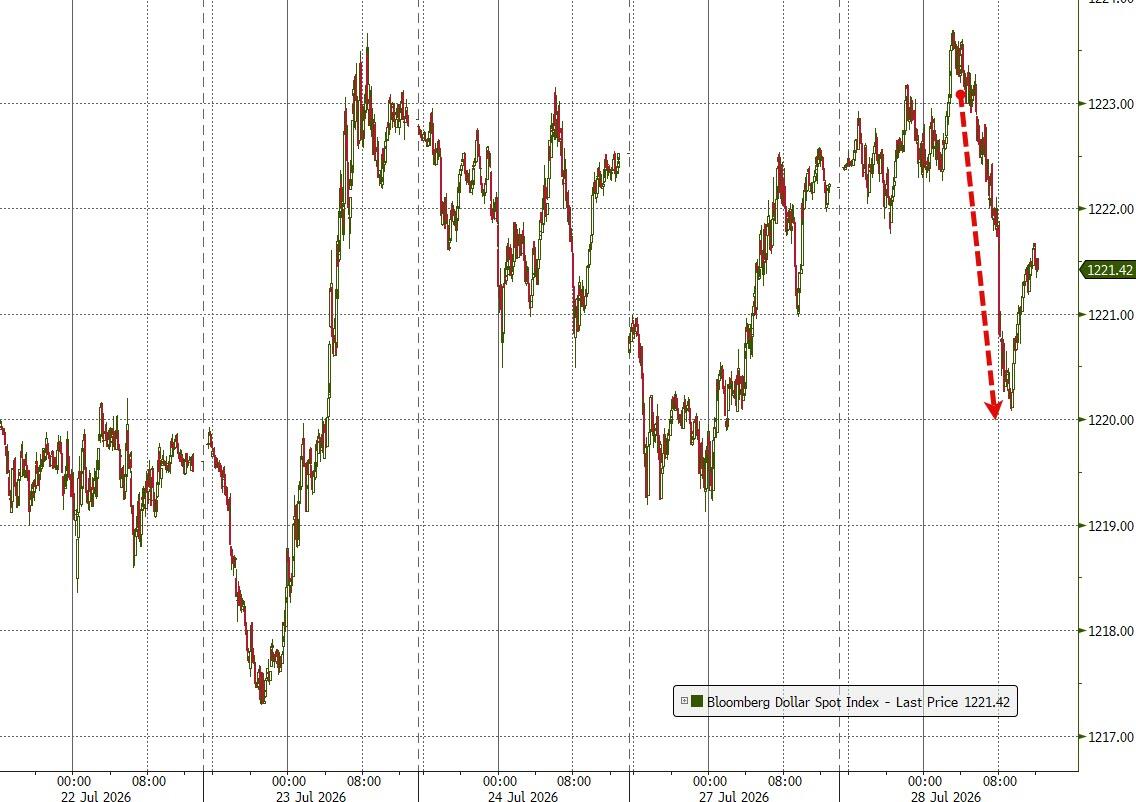
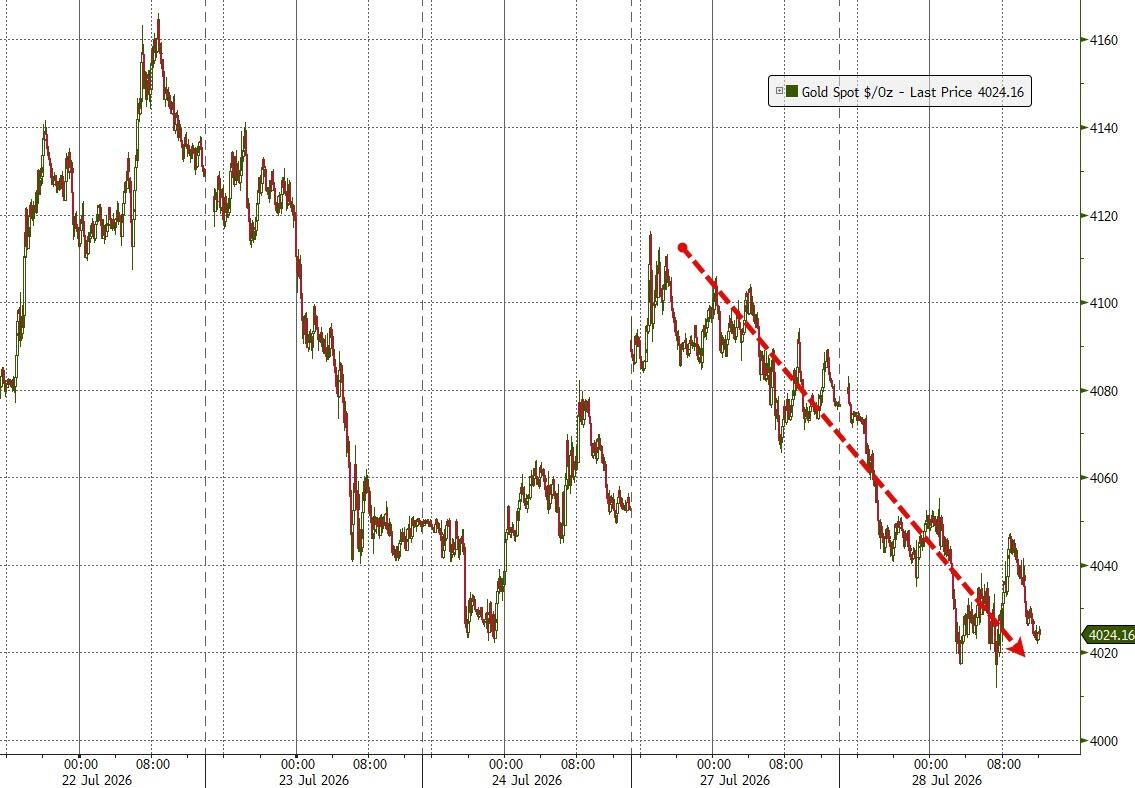
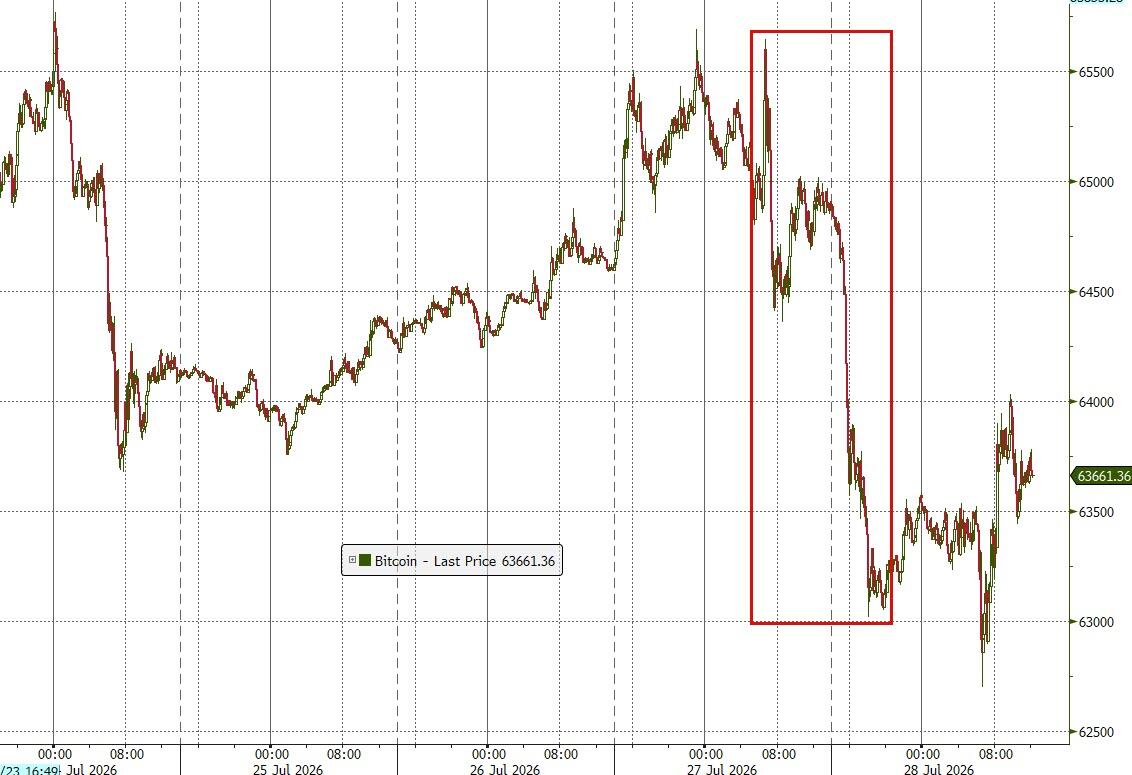
The dollar weakened, gold reclaimed the $4,100 level, and bitcoin tagged along with the tech rally by climbing back above $65,000.
With OPEC+ expected to discuss another production increase on Sunday, the next big question is whether more oil supply will finally translate into some relief at the gas pump, or will consumers need a little more patience?
Stocks came out of the gate on the wrong foot as higher oil prices and continued weakness in chip stocks kept sellers in control.
The Fed’s decision to leave rates unchanged briefly changed the mood, sparking a relief rally that had traders feeling a little better about life.
That optimism didn’t last long.
News of Iran’s surprise missile attack in Jordan quickly shifted the focus back to geopolitics. Oil and bond yields jumped, stocks headed south, and the market’s post-Fed celebration ended about as quickly as a free lunch on Wall Street.
Meanwhile, the dollar took traders on a roller-coaster ride, first climbing and then sliding hard, helping lift gold and giving Bitcoin a boost as it held above the $64,000 level.
In the end, it was one of those days that left traders scratching their heads and wondering why stocks rallied on the Fed news in the first place.
Was today’s real story the Fed, or was it a reminder that geopolitics can still hijack the market at a moment’s notice?
Today’s market action continued to highlight the ongoing rotation beneath the surface.
The Dow posted a solid gain, while the Nasdaq remained under pressure as semiconductor stocks struggled again, leaving the tech-heavy index about 10% below its intraday peak.
The real story is that investors are still shifting money from high-flying technology names into more traditional sectors. That trend has been building for weeks and remained firmly intact today.
Looking ahead, the spotlight now turns to earnings from Microsoft, Meta, Amazon, and Apple, along with Wednesday’s Fed decision.
I expect rates to remain unchanged, but the market will be listening closely for clues about what comes next.
By the close, reports of progress toward easing tensions around the Strait of Hormuz helped improve sentiment, allowing the Nasdaq to recover much of its earlier loss while the Dow finished strongly. Meanwhile, bond yields and the dollar fell, while gold and Bitcoin also moved lower.
With the Fed and Big Tech both taking center stage this week, will they reignite the technology trade, or will this market’s changing leadership continue?
