Weekly StatSheet For The ETF/No Load Fund Tracker Newsletter – Updated Through 04/14/2016

Ulli ETF StatSheet Contact

ETF/Mutual Fund Data updated through Thursday, April 14, 2016

TOC040716

If you are not familiar with some of the terminology used, please see the Glossary of Terms.


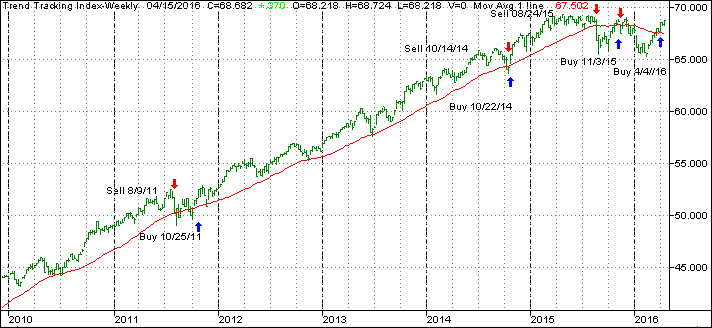
1. DOMESTIC EQUITY MUTUAL FUNDS/ETFs: BUY — since 4/4/2016

TTI

Our main directional indicator, the Domestic Trend Tracking Index (TTI-green line in above chart) has recently crawled above its long term trend line (red) and finally generated a new “Buy” signal effective 11/3/15. The market subsequently dropped, and we exited again on 11/13/15. As of today, the TTI has just moved above its trend line by +1.74%. As of Monday, April 4, 2016 a new Domestic Buy signal became effective as posted on the blog.

Read More

Running Out Of Steam

Ulli Market Commentary, Uncategorized Contact

Thur pic

[Chart courtesy of MarketWatch.com]

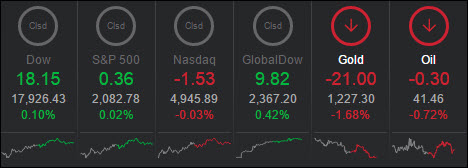
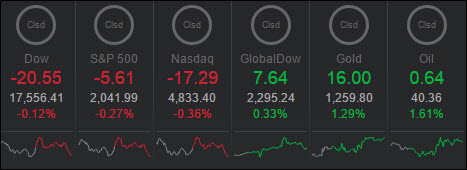
Stocks ended flat Thursday, taking a breather after a nice two day rally.

Trading today was mostly influenced by earnings reports from Bank of America (BAC) and Wells Fargo (WFC). Bank of America topped both earnings and revenue estimates. Wells Fargo topped profit expectations but was slightly below par on revenue. BofA gained and Wells fell slightly.

The results from these two banking giants were a bit of a disappointment after JPMorgan (JPM) posted such strong gains yesterday. But, there has to be a winner sometimes.

We also digested another strong reading on the jobs market here in the U.S. The latest number on weekly jobless claims fell from 266,000 to 253,000 the week before. In addition, the consumer price index (CPI) rose in March. Crude oil stayed above $41 a barrel today, which may give some confidence to the bulls.

Read More

Markets Climb Back To 2016 Highs

Ulli Market Commentary Contact

Wed pic

[Chart courtesy of MarketWatch.com]

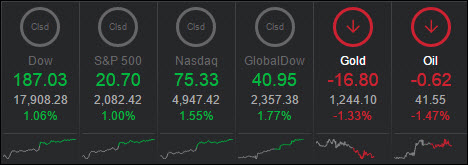
Markets soared higher today on strong earnings from JPMorgan that resulted in bullish sentiment on upcoming report cards for the financial sector. That’s the official MSM version.

Mine is that if you set the earnings bar low enough, the numbers can be beat, which happened today and resulted in a lift of share prices for the banking sector despite it being the worst start to a new year since the 2007-2008 crisis, as financial stocks dropped 5.6% for the quarter. Again, the very low bottom line was beat and nothing else mattered as shares of JP Morgan and American Express kept the rally alive. Let’s see if this theme continues when Bof A and Wells Fargo report on Thursday.

While retail sales data were absolutely horrific, it did not matter as the Fed opined that the domestic economy continues to plow ahead in a positive direction with solid advances in the labor market and housing offsetting a mixed performance in the manufacturing sector.

Consumer spending, which makes up 70% of economic activity, appeared to slow. But there were two possible bright spots: Slow wage growth appears to be picking up and business spending is generally expanding.

With earnings season getting underway, I am curious to see if the headline scanning computer algos will use any “beat” of the extremely low expectations to generate another rally. If so, we should be able to take out the all-time highs by the end of April; of course, I am being facetious here, but in this manipulated market environment you can never be sure.

Read More

Oil And Equities: Back To 100% Correlation

Ulli Market Commentary Contact

Tue pic

[Chart courtesy of MarketWatch.com]

1. Moving the Markets

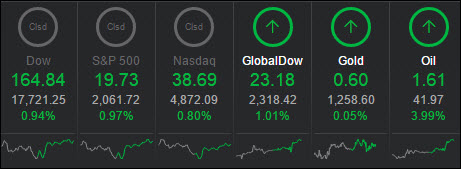
 Stocks posted strong gains today, rising nearly 1% across the board.

Oil, as it has been (and seems like will be for the near future) was “the” big market mover. The black gold gained 3.96% to move above $41 a barrel, which makes economic bulls even more bullish.

In the world of ETFs, energy based funds are posting substantial gains on renewed hopes of cuts in oil production. There is an alleged meeting this week between major oil powers, the same type of story concerning reduced production we’ve heard about over and over again in the recent past. My guess is that this one will end like all the other ones: In disappointment.

Coming up in earnings this week, a dozen companies in the S&P 500 will report, including big banks such as JPMorgan Chase (JPM), Bank of America (BAC), Wells Fargo (WFC) and Citigroup (C). Expectations remain low, however, as profits are expected to contract more than 7% for S&P 500 companies.

Let’s see how the markets will respond to moving oil prices and the upcoming earnings reports this week.

Read More

Early Rally Runs Out Of Steam—Indexes Slip Into The Red

Ulli Market Commentary Contact

Mon pic

[Chart courtesy of MarketWatch.com]

1. Moving the Markets

All three U.S. benchmarks began the day in positive ground, before sliding back. About mid-afternoon, they faltered into negative territory, ending at session lows by the closing bell.

The buzz of late has been all about earnings expectations and how the market will react. If earnings come in negative in the January-March quarter as expected, it will mark the third straight quarter of negative growth. Profits were hurt by financial turbulence, a strong dollar that hurt sales of U.S. multinationals and the continuing fallout from low prices in the energy patch.

The unofficial kickoff to earnings season came after the closing bell when aluminum giant Alcoa (AA) reported its results, which topped analysts’ sharply crushed expectations. While revenues fell 15% YOY, a 6% gain was offset by a 21% decline caused by low aluminum prices and a strong dollar. This was accomplished via extremely creative accounting magic, as you can read here.

Moving forward, let’s keep in mind that Wall Street will be closely watching financials, commodities and the impact of the dollar on corporate profit results. Financials face continued headwinds due to a small gap between short-term and long-term interest rates, as well as early-year market turbulence that negatively impacted trading results. And despite a sharp recovery in energy prices, analysts continue to mark down earnings in the energy sector as non-performing loans are looming on the horizon.

Read More

ETFs/Mutual Funds On The Cutline – Updated Through 04/08/2016

Ulli ETFs on the Cutline Contact

Below are the latest ETF Cutline reports, which show how far above or below their respective long-term trend lines (39 week SMA) my currently tracked ETFs/MFs are positioned.

The first report covers the ETF Master List from Thursday’s StatSheet and includes 381 ETFs, of which currently 218 (last week 246) are hovering in bullish territory.

The second report includes only High Volume ETFs. To clarify, High Volume (HV) ETFs are defined as those with an average daily volume of $10 million or higher. Volume figures can change in a hurry, so be sure to check first before investing.

These ETFs are generated from my selected list of 98 that I use in my advisor practice. It cuts out the “noise,” which simply means it eliminates those ETFs that I would never buy because of their volume limitations. 47 ETFs (last week 56) have managed to remain in bullish territory after the recent market volatility.

The third report covers Mutual Funds on the Cutline. There are currently 193 (last week 237) above the line and 587 below it out of the 780 that I follow.

Take a look:

  1. ETF Master Cutline Report
  2. ETF High Volume Cutline Report
  3. MF Cutline Report

In case you are not familiar with some of the terminology used in the reports, please read the Glossary of Terms.

If you missed the original post about the Cutline approach, you can read it here.