
1. Moving the Markets
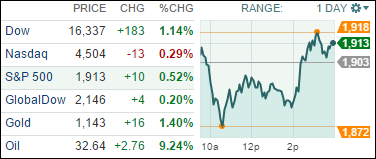
It was a wild session with the indexes meandering in the red most of the day when the tug-of war between oil and weaker than expected economic data came to an end with oil shooting straight up and gaining some 9% on the day.
Of course, as we’ve seen lately, there was no rhyme or reason behind oil’s sudden stratospheric move other the usual OPEC jawboning about emergency meetings to discuss potential production cuts. Fundamentally, oil looked horrible with soaring inventories, unchanged production and weakening demand.
Economic data in regards to the services economy and ADP reports were poor causing the initial drop in the markets. But none of it mattered as the bulls managed to avoid massive downside disaster—at least for today. It’s a good time to sit on the sidelines and watch this non-directional volatility show play itself out.
8 of our 10 ETFs in the Spotlight eked out a gain led by the Dividend ETF (DVY) with +1.31%. Consumer Discretionaries (XLY) were the loser of the day with -0.26%.
2. ETFs in the Spotlight
In case you missed the announcement and description of this section, you can read it here again.
It features 10 broadly diversified ETFs from my HighVolume list as posted every Monday. Furthermore, they are screened for the lowest MaxDD% number meaning they have been showing better resistance to temporary sell offs than all others over the past year.
Here are the 10 candidates:
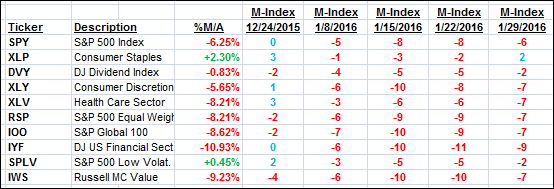
The above table simply demonstrates the magnitude with which some of the ETFs are fluctuating in regards to their positions above or below their respective individual trend lines (%M/A). A break below, represented by a negative number, shows weakness, while a break above, represented by a positive percentage, shows strength.
For hundreds of ETF/Mutual fund choices, be sure to reference Thursday’s StatSheet.
Year to date, here’s how the above candidates have fared so far:
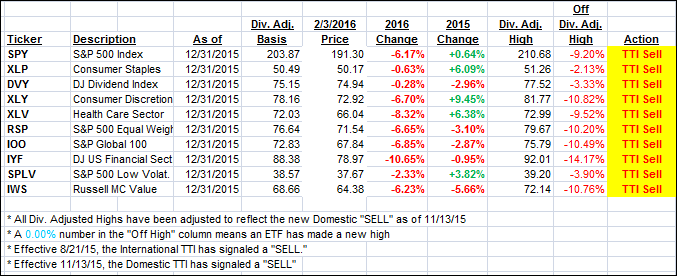
Again, the first table above shows the position of the various ETFs in relation to their respective long term trend lines (%M/A), while the second one tracks their trailing sell stops in the “Off High” column. The “Action” column will signal a “Sell” once the -7.5% point has been taken out in the “Off High” column.
3. Trend Tracking Indexes (TTIs)
Our Domestic Trend Tracking Index (TTI) barely changed, which had no effect on our current bearish position.
Here’s how we ended up:
Domestic TTI: -2.44% (last close -2.61%)—Sell signal effective 11/13/2015
International TTI: -10.24% (last close -10.30%)—Sell signal effective 8/21/2015
Disclosure: I am obliged to inform you that I, as well as advisory clients of mine, own some of these listed ETFs. Furthermore, they do not represent a specific investment recommendation for you, they merely show which ETFs from the universe I track are falling within the guidelines specified.
Contact Ulli