
1. Moving the Markets
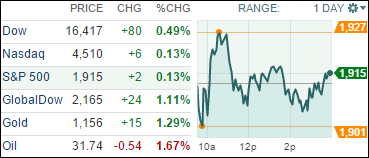
Volatility in oil and currency markets was on again as the S&P 500 dropped towards the 1,900 level, rebounded to make new highs for the day, went sideways but managed to close slightly in the green.
Crude oil was the predominant driver pushing the major indexes above and below their respective unchanged lines as the U.S dollar experienced its largest one-day drop vs. the Euro. U.S. service sector activity was very disappointing but with the mantra “bad news is good news” back in play, this was interpreted as the Fed possibly putting off future interest rate increases, a view that was echoed by Fed Gov Dudley.
5 of our 10 ETFs in the Spotlight closed up and 5 closed down. Heading the gainers were the Financials (IYF) with +0.75%, while on the losing side Consumer Staples (XLP) took the lead with -0.92%.
2. ETFs in the Spotlight
In case you missed the announcement and description of this section, you can read it here again.
It features 10 broadly diversified ETFs from my HighVolume list as posted every Monday. Furthermore, they are screened for the lowest MaxDD% number meaning they have been showing better resistance to temporary sell offs than all others over the past year.
Here are the 10 candidates:
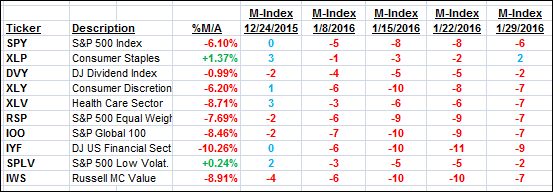
The above table simply demonstrates the magnitude with which some of the ETFs are fluctuating in regards to their positions above or below their respective individual trend lines (%M/A). A break below, represented by a negative number, shows weakness, while a break above, represented by a positive percentage, shows strength.
For hundreds of ETF/Mutual fund choices, be sure to reference Thursday’s StatSheet.
Year to date, here’s how the above candidates have fared so far:
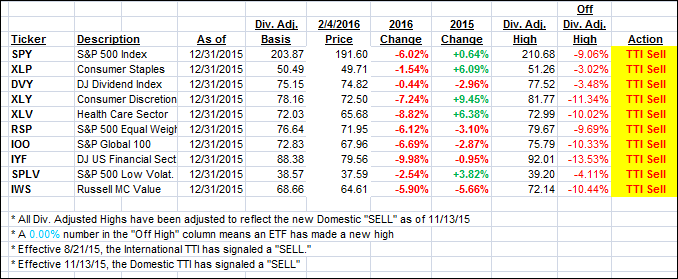
Again, the first table above shows the position of the various ETFs in relation to their respective long term trend lines (%M/A), while the second one tracks their trailing sell stops in the “Off High” column. The “Action” column will signal a “Sell” once the -7.5% point has been taken out in the “Off High” column.
3. Trend Tracking Indexes (TTIs)
Our Domestic Trend Tracking Index (TTI) only changed slightly as the markets predominantly went sideways.
Here’s how we closed:
Domestic TTI: -2.36% (last close -2.44%)—Sell signal effective 11/13/2015
International TTI: -9.70% (last close -10.24%)—Sell signal effective 8/21/2015
Disclosure: I am obliged to inform you that I, as well as advisory clients of mine, own some of these listed ETFs. Furthermore, they do not represent a specific investment recommendation for you, they merely show which ETFs from the universe I track are falling within the guidelines specified.
Contact Ulli