
1. Moving the Markets
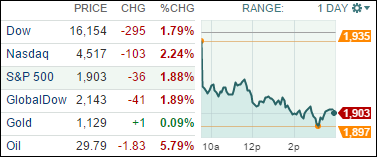
The lack of correlation between oil prices and the major indexes I pointed out yesterday reversed with a vengeance as oil dropped another 5.79% on top of yesterday’s loss of 6.78% causing the markets to head south all day with no recovery in sight.
Crude oil stumbling below $30/barrel accelerated a downdraft in energy and banking shares and even strong gains from Google’s parent Alphabet, Inc. were not able to stem the bearish tide.
The current market concerns range from the realization that Japan’s new NIRP (Negative Interest Rate) policy may very well spell the end of the stimulus cycle (QE) and not just economies around the world will have to learn to do without it but also equities, which have become addicted to a constant flow of Fed QE juice over the past 7 years.
It looks to me that the major stock indexes will have a hard time justifying current price levels without any further Fed assistance of easy money. In other words, the bear market appears to be just in its beginning stages.
Our 10 ETFs in the Spotlight headed south and closed unanimously in the red. Heading the group was the Financials (IYF) with -2.45%. Resisting the sell off fairly well was the Dividend ETF (DVY) with -0.90%.
2. ETFs in the Spotlight
In case you missed the announcement and description of this section, you can read it here again.
It features 10 broadly diversified ETFs from my HighVolume list as posted every Monday. Furthermore, they are screened for the lowest MaxDD% number meaning they have been showing better resistance to temporary sell offs than all others over the past year.
Here are the 10 candidates:
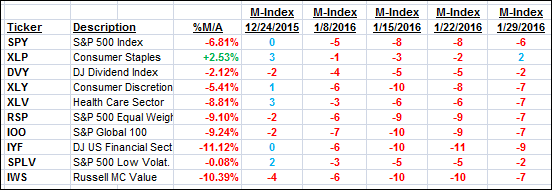
The above table simply demonstrates the magnitude with which some of the ETFs are fluctuating in regards to their positions above or below their respective individual trend lines (%M/A). A break below, represented by a negative number, shows weakness, while a break above, represented by a positive percentage, shows strength.
For hundreds of ETF/Mutual fund choices, be sure to reference Thursday’s StatSheet.
Year to date, here’s how the above candidates have fared so far:
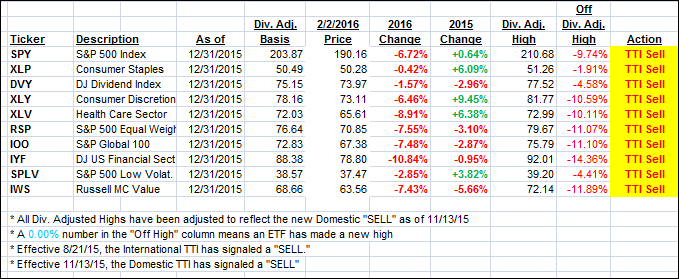
Again, the first table above shows the position of the various ETFs in relation to their respective long term trend lines (%M/A), while the second one tracks their trailing sell stops in the “Off High” column. The “Action” column will signal a “Sell” once the -7.5% point has been taken out in the “Off High” column.
3. Trend Tracking Indexes (TTIs)
Our Domestic Trend Tracking Index (TTI) headed south and moved deeer into bear market territory.
Here’s how we ended up:
Domestic TTI: -2.61% (last close -2.03%)—Sell signal effective 11/13/2015
International TTI: -10.30% (last close -8.77%)—Sell signal effective 8/21/2015
Disclosure: I am obliged to inform you that I, as well as advisory clients of mine, own some of these listed ETFs. Furthermore, they do not represent a specific investment recommendation for you, they merely show which ETFs from the universe I track are falling within the guidelines specified.
Contact Ulli