
- Moving the markets
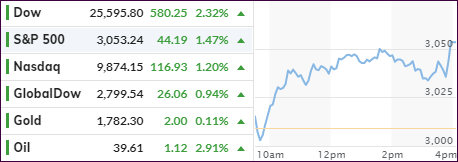
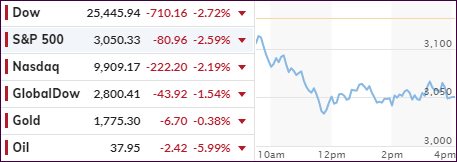
The explosion in US Pending Home Sales was the tie breaker today after reports that New Home Sales soared, and Existing Homes Sales plunged. The computer algos went with the rebound of 44.3% vs. 19.3% expected Pending Home Sales and pushed the major indexes to a solid green close, However, it was not enough to make up for Friday’s drubbing.
Still, concerns about the economic outlook was on traders’ minds, but hope prevailed that some of the planned shutdowns may be focused on only those areas with severe Covid-19 increases.
Coronavirus cases world-wide surpassed 10 million, with more than a half-million deaths. A dozen states, including Florida, Texas, California, and Arizona — now hot spots in the U.S. — reversed reopening plans and implemented tighter restrictions to prevent a further spread of the viral epidemic, The Wall Street Journal reported.
Some of today’s push to the upside was end-of-quarter adjustments by mutual funds, pension plans and investment managers, an activity that is also known as window dressing, which could certainly increase volatility during this Holiday-shortened week.
Added Peter Cardillo, chief market economist at Spartan Capital:
“However, the trend is likely to remain negative ahead of this week’s key macro indicators and the upcoming earnings season,” he said, referring to corporate quarterly results that kick off in earnest in the middle of July.
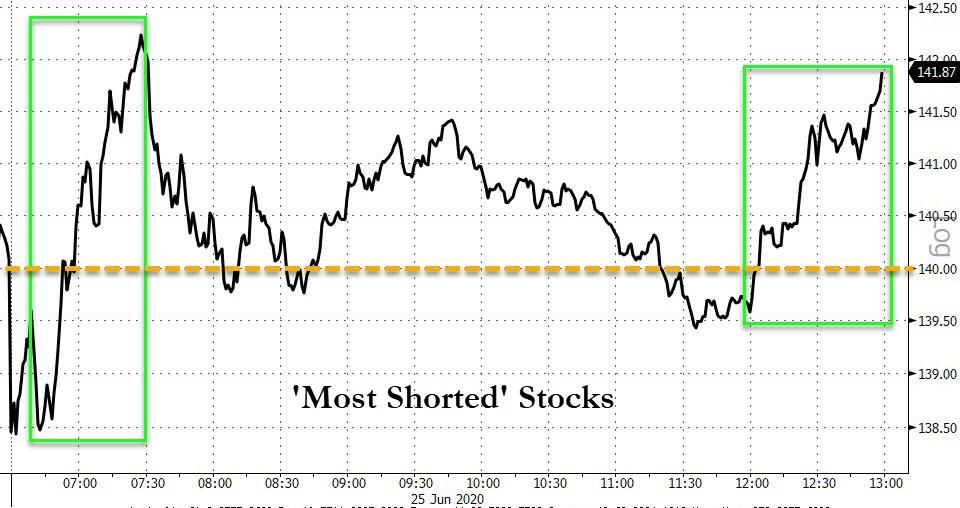
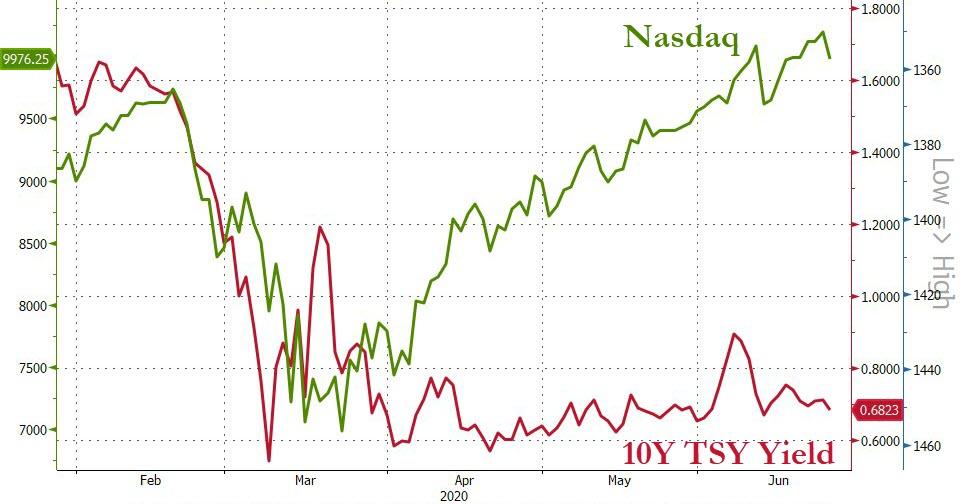
In the end we saw something unusual, as ZH pointed out:
Stocks up, Bonds up, Dollar up, Gold up, Bitcoin up… COVID-cases Up…
That’s all part of the new normal.
Read More
