
- Moving the markets
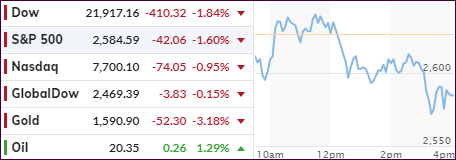
An early rebound hit a brick wall, as this month/quarter turned out to be nothing but misery for the buy-and-hold crowd. To wit, during March, the major indexes lost big time with the S&P 500 plunging -12.5% vs. 0% for those who followed my trend tracking guidelines, which called for “all cash” effective 2/27/20.
Keep in mind that the -12.5% loss for the S&P 500 happened despite a huge rebound last week, which was powered by massive quarterly-ending rebalancing efforts. Otherwise, the index would have been down over 30%. In the end, the S&P 500 ended “only” down some -20% for the quarter. Ouch!
Much of this market deterioration has been blamed on the coronavirus, but this virus was merely a bug in search of a windshield, and it finally found one. As I posted before, the financial markets were long overdue for a serious correction, and Covid-19 was purely the pin that pricked the bubble.
Helping today’s early bullish theme were preliminary reports of what’s in store with consumer confidence, Chicago PMI and Chinese manufacturing, which were coming in better than expected, but I don’t think that encompasses the month of March, during which econ numbers look to have taken a steep dive with the country shutting down.
ZeroHedge posted the question: So, how bad was Q1? And answered it with this chart confirming that it was the world’s biggest quarterly capitalization loss in bonds and stocks ever…during which stocks lost a record-smashing $19.6 trillion…
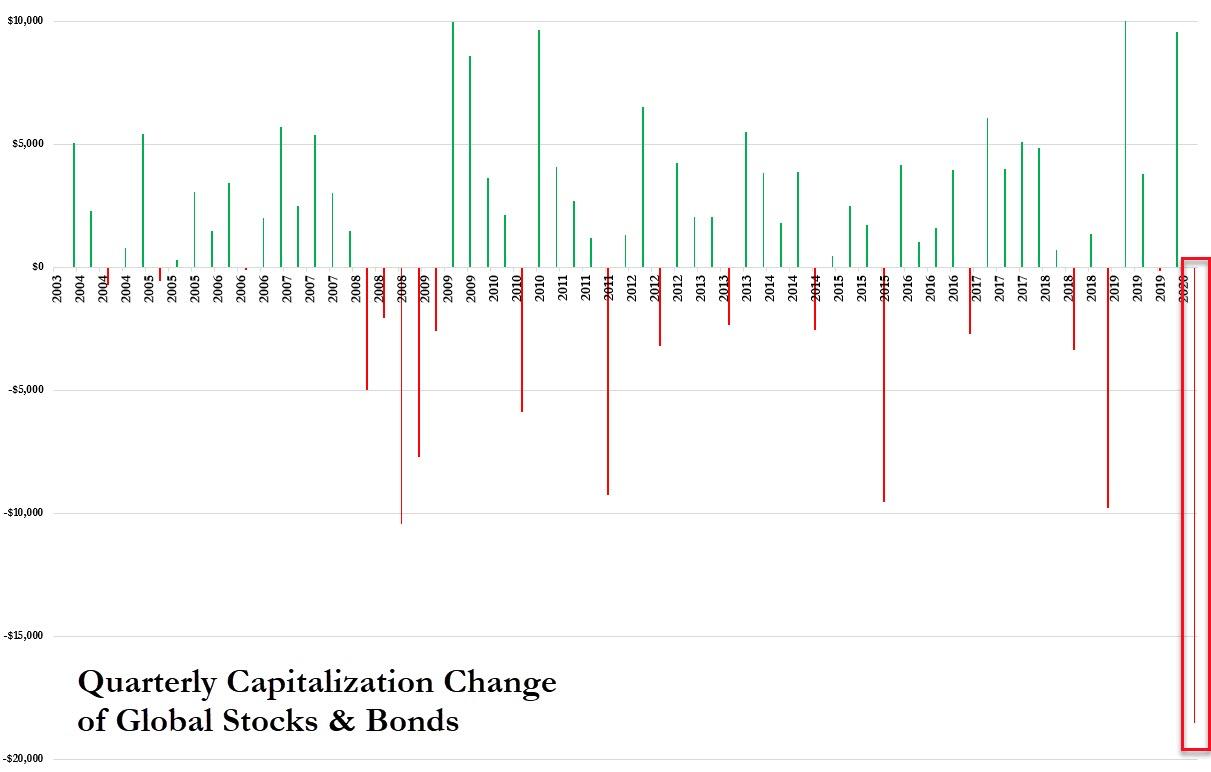
So, the big question is “how low can we go?” While no one has that answer, one argument is that markets need to adjust to forward earnings. If that is true, as Bloomberg demonstrates in this chart, somewhere in the neighborhood of 1,600 for the S&P 500 might be a stopping point.
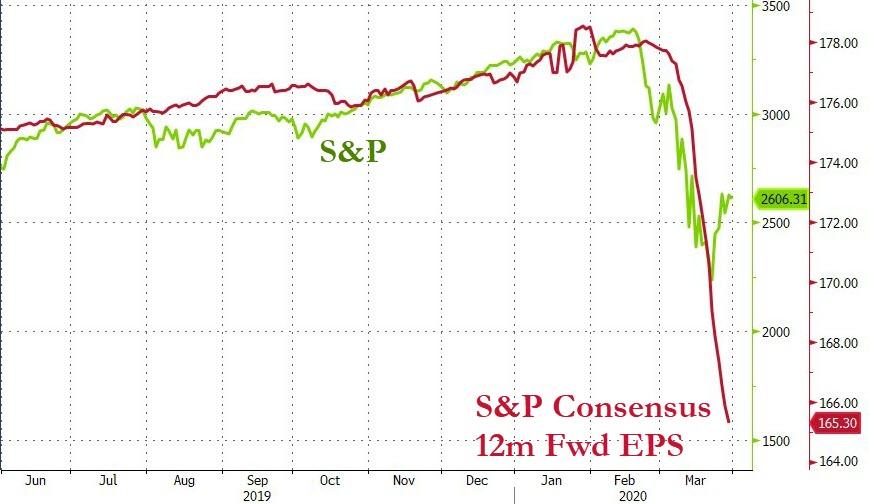
No one knows if that will happen, but I think it’s a possibility, so my preference, for the time being, is watching this develop from the sidelines.
2. ETFs in the Spotlight
In case you missed the announcement and description of this section, you can read it here again.
It features some of the 10 broadly diversified domestic and sector ETFs from my HighVolume list as posted every Saturday. Furthermore, they are screened for the lowest MaxDD% number meaning they have been showing better resistance to temporary sell offs than all others over the past year.
The below table simply demonstrates the magnitude with which these ETFs are fluctuating above or below their respective individual trend lines (%+/-M/A). A break below, represented by a negative number, shows weakness, while a break above, represented by a positive percentage, shows strength.
For hundreds of ETF choices, be sure to reference Thursday’s StatSheet.
For this past domestic “Buy” cycle, which ended on 2/27/2020, here’s how some our candidates have fared:
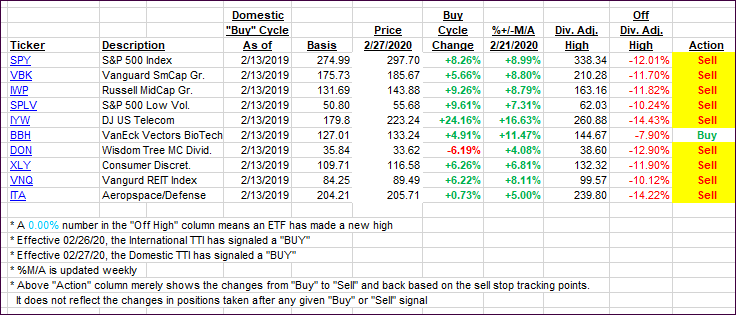
Click image to enlarge
Again, the %+/-M/A column above shows the position of the various ETFs in relation to their respective long-term trend lines, while the trailing sell stops are being tracked in the “Off High” column. The “Action” column will signal a “Sell” once the -8% point has been taken out in the “Off High” column. For more volatile sector ETFs, the trigger point is -10%.
In my advisor practice, we may or may not be invested in some of the 10 ETFs listed above.
3. Trend Tracking Indexes (TTIs)
Our TTIs slipped as the major indexes dove into close.
Here’s how we closed 03/31/2020:
Domestic TTI: -21.53% below its M/A (prior close -20.04%)—Sell signal effective 02/27/2020
International TTI: -19.07% below its M/A (prior close -18.91%)—Sell signal effective 02/26/2020
Disclosure: I am obliged to inform you that I, as well as my advisory clients, own some of the ETFs listed in the above table. Furthermore, they do not represent a specific investment recommendation for you, they merely show which ETFs from the universe I track are falling within the specified guidelines.
Contact Ulli