
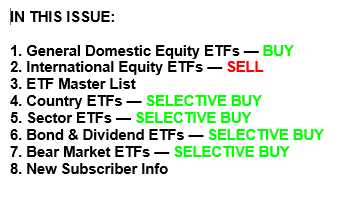
- Moving the markets
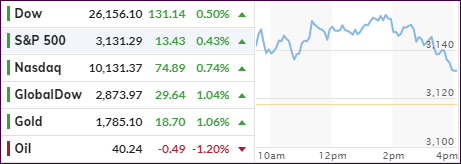
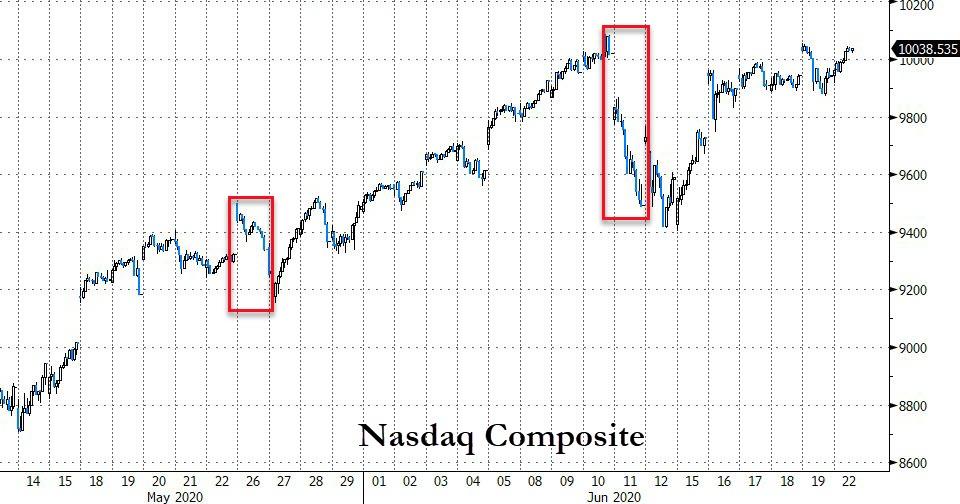
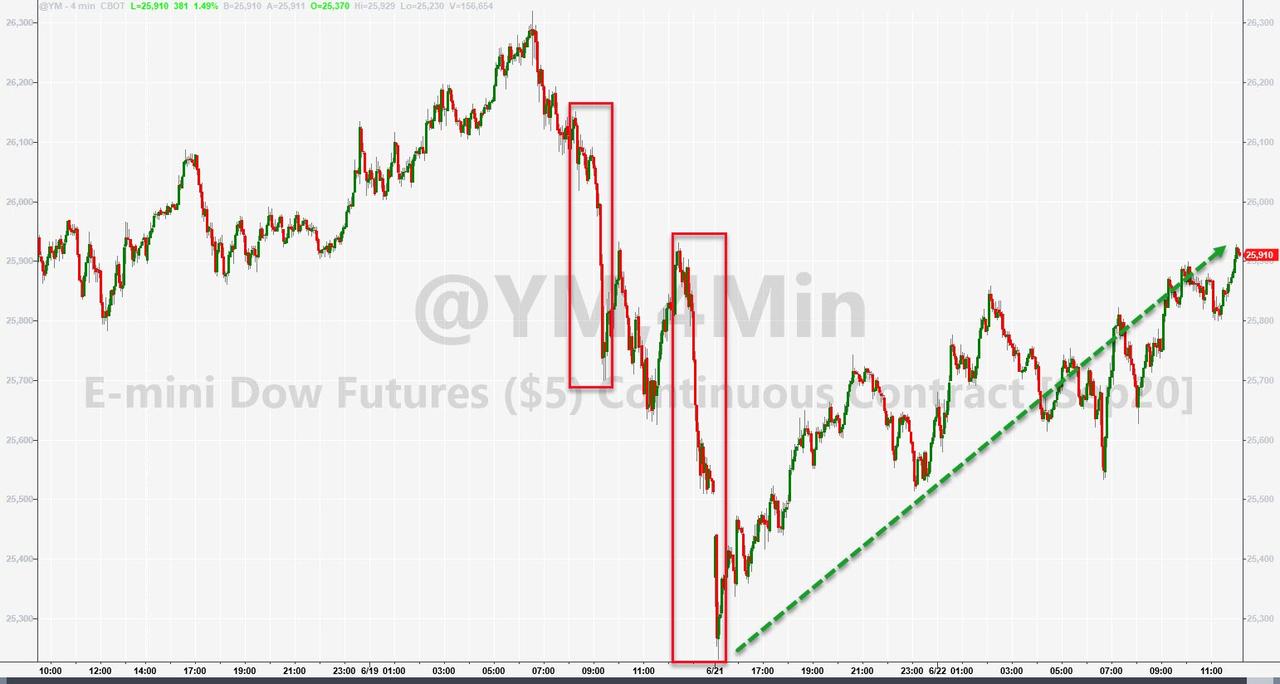
Yesterday was one of those moments, while watching the futures markets, when I had to laugh out loud. The major indexes were creeping higher when suddenly the bottom dropped out with the Down plunging over 500 points in minutes.
Turns out that Trump’s trade advisor Navarro responded during a Fox News interview regarding the China trade deal: “It’s over. Yes.” The fallout was imminent, and it appears that Navarro got a tap on the shoulder and hastily walked his comments back as “having been taken wildly out of context” pushing the futures back up.
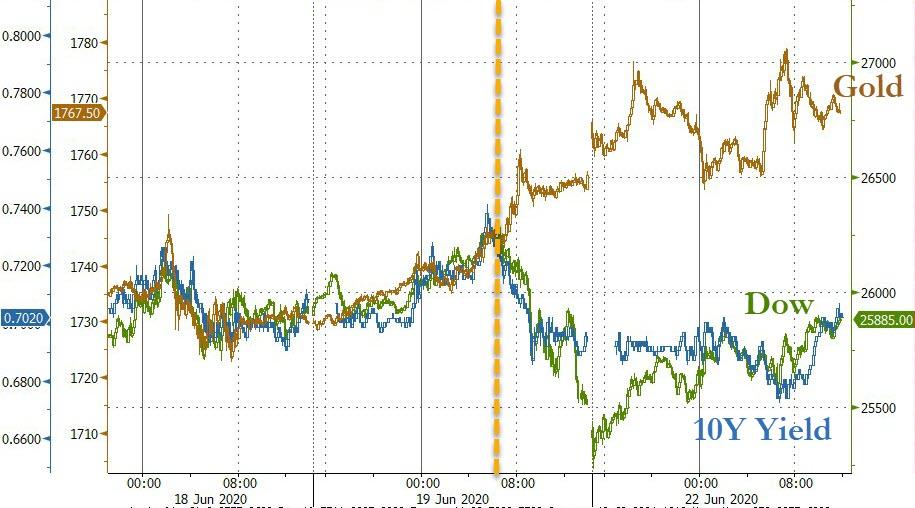
Thanks to ZH, here’s a graphic representation of the events:
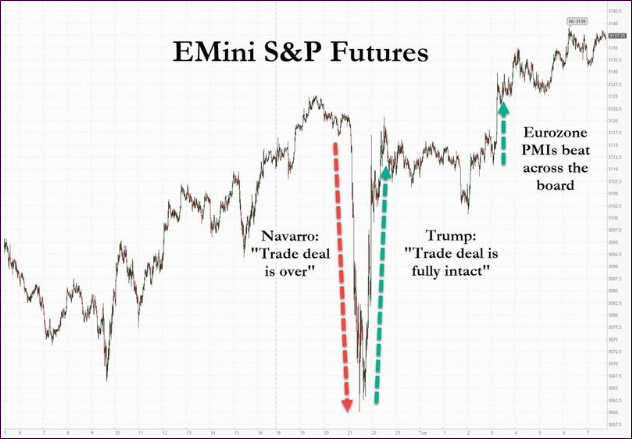
And the summary:
Navarro dump – US-China trade deal “is over”
Trump pump – US-China trade deal “fully intact”
Kudlow pump – “absolutely, definitely” no second lock-down due to virus
Fauci slump – “disturbing surge” in infections
Fauci pump – “promising” vaccine is imminent
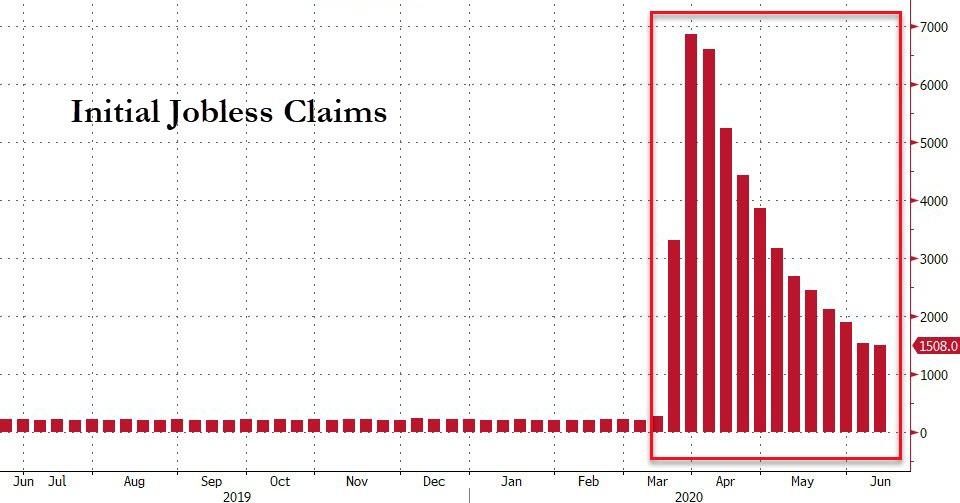
The regular session had bullish undertones helped by US New Homes Sales, which soared in May, but the manufacturing and service sectors disappointed, as Labor weakness continued.
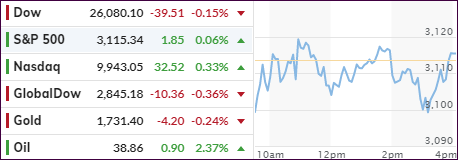
While the broad market continues to linger, the main story is all about the tech sector with Apple and Netflix scoring to new highs, as the Nasdaq notched a new intra-day record.
Despite the re-opening efforts with business trying to play catchup, Covid-19 is still on everyone’s mind, as MarketWatch reports:
Dr. Anthony Fauci, the nation’s top infectious disease expert, warned on Tuesday that the “next couple of weeks are going to be critical” in terms of the addressing a “disturbing surge” in COVID-19 cases across the United States, while also vowing to ramp up, not slow down, testing for the virus, in testimony before Congress on the federal response to the pandemic.
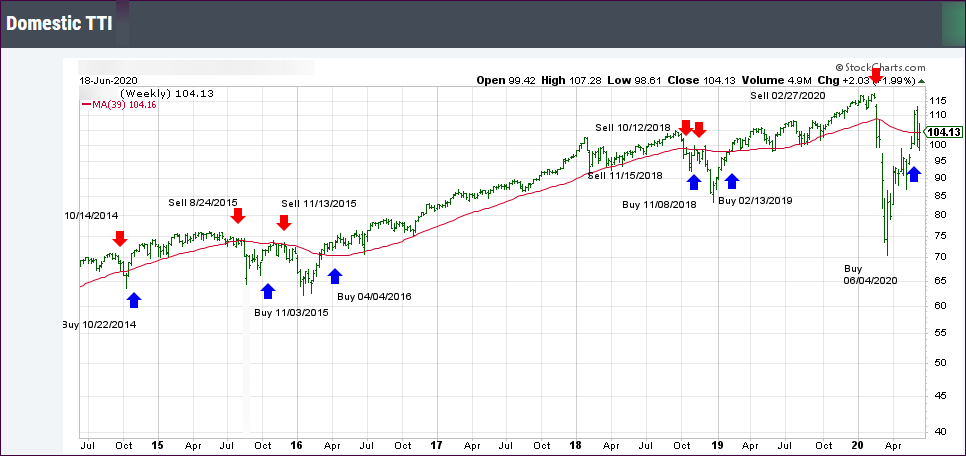
Again, broad markets lagged, which also explains why our Domestic TTI has not crossed back above its long-term trend line into bullish territory but lingers slightly below it.
This indicates that we continue to be stuck in the neutral zone, meaning we’re holding on to our positions until more evidence of either bullishness or bearishness emerges, which will then signal our next cause of action: Buy more or Sell all.
Read More