
- Moving the markets
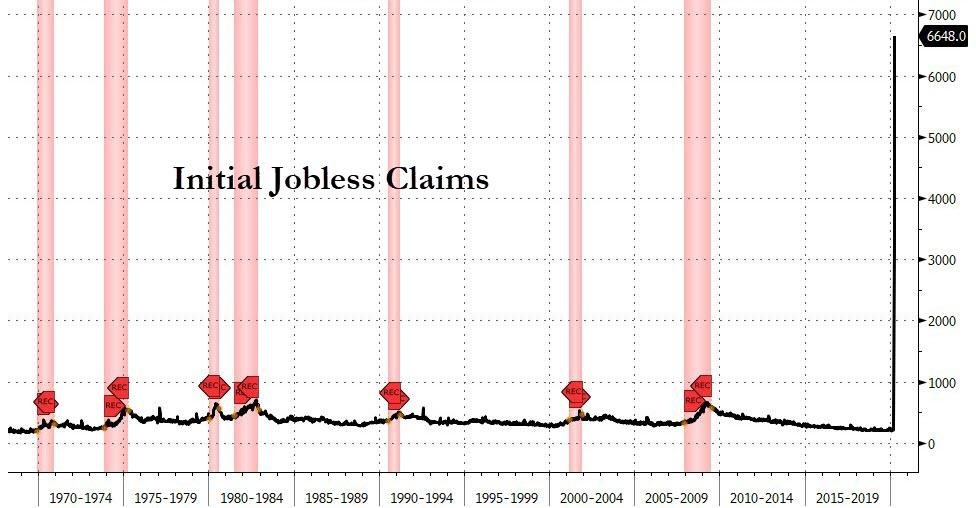
The futures markets crashed into the red last night, despite a strong start to the session. The cause was another unprecedented surge in initial jobless claims, after last week’s record 3.3 million rise, but this week, we added 6.648 million for a two-week grand total of 10 million new people claiming unemployment benefits, as ZeroHedge pointed out.
So, what do you do when you know the markets are about to get slaughtered again?
You create a rumor. And that is exactly what the White House did, as Trump tweeted this:
Just spoke to my friend MBS (Crown Prince) of Saudi Arabia, who spoke with President Putin of Russia, & I expect & hope that they will be cutting back approximately 10 Million Barrels, and maybe substantially more which, if it happens, will be GREAT for the oil & gas industry!
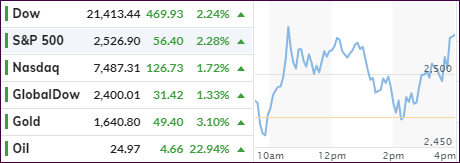
That’s all it took to shift the computer algos into high hear with the Dow at one point being up some 500 points, after which it lost all of its gains and dipped below the unchanged line before recovering and storming back towards the highs of the day.
ZeroHedge clarified the events as follows:
The mid-day volatility was a result of Russia’s energy minister emphasizing that instead of cutting supply, Russia will wait for demand to return.
The Dow Jones news service made it clear that, according to Saudi sources, Trump’s tweet was nothing but a baseless oil price manipulation:
- SAUDI OFFICIAL SAY TRUMP’S TALK OF 10 MILLION BBL A DAY CUT OR ABOVE WAS AN EXAGGERATION
Finally, Moscow confirmed where to expect the oil prices in the coming year:
- RUSSIA IS SAID TO BASE REVISED 2020 BUDGET PLAN ON $20 OIL
After all this, it makes me laugh out loud how oil prices could have gained 23% and stocks participated with an over 2% advance, while 10 million Americans lost their jobs in 2 weeks’ time.
Maybe, it was simply another overdue dead-cat bounce.
2. ETFs in the Spotlight
In case you missed the announcement and description of this section, you can read it here again.
It features some of the 10 broadly diversified domestic and sector ETFs from my HighVolume list as posted every Saturday. Furthermore, they are screened for the lowest MaxDD% number meaning they have been showing better resistance to temporary sell offs than all others over the past year.
The below table simply demonstrates the magnitude with which these ETFs are fluctuating above or below their respective individual trend lines (%+/-M/A). A break below, represented by a negative number, shows weakness, while a break above, represented by a positive percentage, shows strength.
For hundreds of ETF choices, be sure to reference Thursday’s StatSheet.
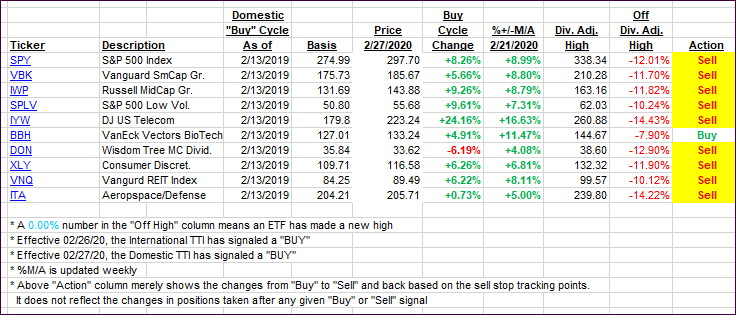
For this past domestic “Buy” cycle, which ended on 2/27/2020, here’s how some our candidates have fared:
Click image to enlarge
Again, the %+/-M/A column above shows the position of the various ETFs in relation to their respective long-term trend lines, while the trailing sell stops are being tracked in the “Off High” column. The “Action” column will signal a “Sell” once the -8% point has been taken out in the “Off High” column. For more volatile sector ETFs, the trigger point is -10%.
In my advisor practice, we may or may not be invested in some of the 10 ETFs listed above.
3. Trend Tracking Indexes (TTIs)
Our TTIs reversed slightly, as the major indexes were pushed higher by the oil saga.
Here’s how we closed 04/02/2020:
Domestic TTI: -24.22% below its M/A (prior close -25.39%)—Sell signal effective 02/27/2020
International TTI: -21.34% below its M/A (prior close -22.38%)—Sell signal effective 02/26/2020
Disclosure: I am obliged to inform you that I, as well as my advisory clients, own some of the ETFs listed in the above table. Furthermore, they do not represent a specific investment recommendation for you, they merely show which ETFs from the universe I track are falling within the specified guidelines.
Contact Ulli