
- Moving the markets
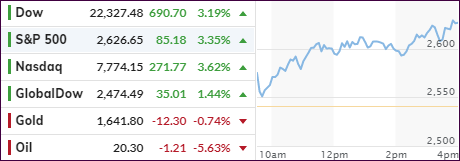
Despite Trump’s announcement Sunday night that he had extended the social distancing guidelines through April 30th, which translates into a continued shutdown of food, entertainment and other service industries, you would not know it by today’s market reaction.
After a sight opening dip, the bullish theme was maintained, and the major indexes were pumped into the close. Sure, some of the traders’ attention was focused on the efforts to slow down the spread of the virus, but news reports did not show any earthshattering improvements.
It seems that the quarter-end balancing, which contained another $150 billion in re-allocations, according to ZeroHedge, was enough to sustain the bullish theme for another day. We may see another push higher tomorrow, but I doubt that this will carry into April.
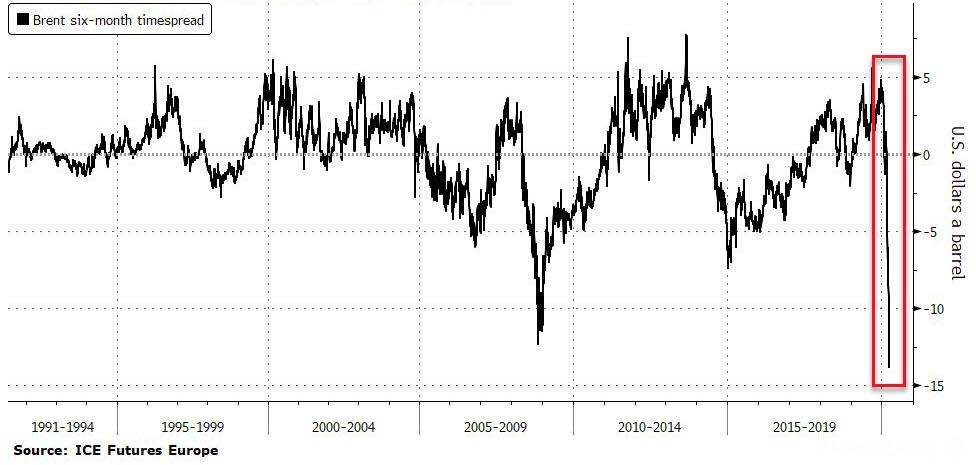
Just as noteworthy has been the crude oil crash, down another 6% today, with the $20 level about to be taken out soon, with some futures already trading at $13.30. Bloomberg posted this chart for clarity.
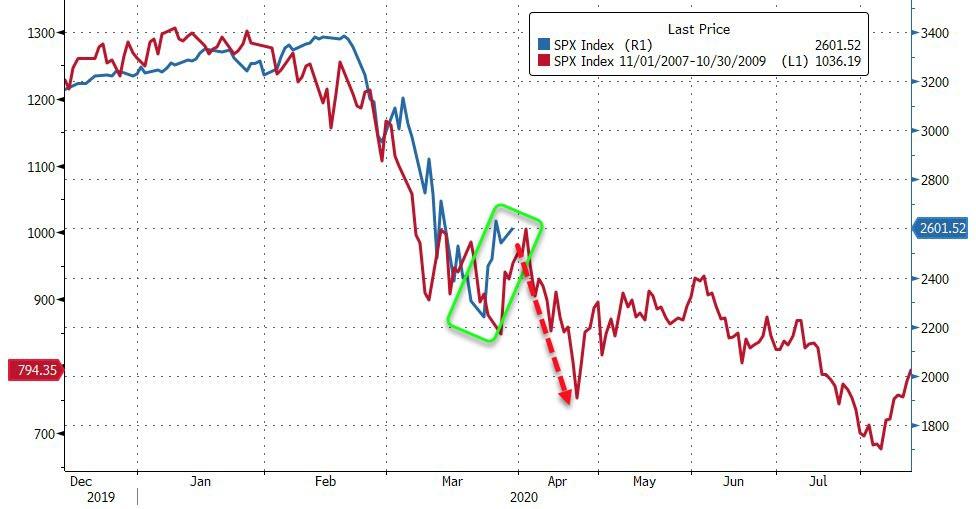
To me, the always interesting and entertaining comparisons to historical events, such as past market crashes, may have some validity, with Bloomberg posting the latest comparing the S&P now compared to 2008 in this chart. We will soon find out how this analog holds up, and my guess is that more clarity will set in during the month of April.
Despite last week’s rebound, we’re still stuck in bear market territory, and I believe the downward trend will continue but will be interrupted by breathtaking rebounds from time to time.
Right now, it pays to be safe than sorry.
2. ETFs in the Spotlight
In case you missed the announcement and description of this section, you can again.
It features 10 broadly diversified and sector ETFs from my HighVolume list as posted every Saturday. Furthermore, they are screened for the lowest MaxDD% number meaning they have been showing better resistance to temporary sell offs than all others over the past year.
The below table simply demonstrates the magnitude with which some of the ETFs are fluctuating regarding their positions above or below their respective individual trend lines (%+/-M/A). A break below, represented by a negative number, shows weakness, while a break above, represented by a positive percentage, shows strength.
For hundreds of ETF choices, be sure to reference Thursday’s StatSheet.
For this past domestic “Buy” cycle, which ended on 2/27/2020, here’s how some our candidates have fared:
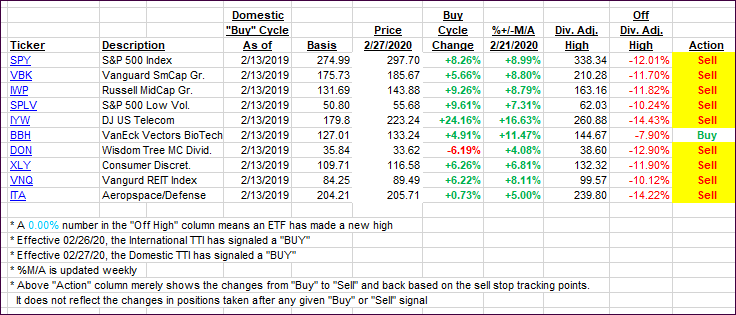
Click image to enlarge
Again, the %+/-M/A column above shows the position of the various ETFs in relation to their respective long-term trend lines, while the trailing sell stops are being tracked in the “Off High” column. The “Action” column will signal a “Sell” once the -8% point has been taken out in the “Off High” column. For more volatile sector ETFs, the trigger point is -10%.
3. Trend Tracking Indexes (TTIs)
Our TTIs improved as the quarter ending push drove the major indexes higher.
Domestic TTI: -20.04% below its M/A (prior close -22.09%)—Sell signal effective 02/27/2020
International TTI: -18.91% below its M/A (prior close -19.89%)—Sell signal effective 02/26/2020
Disclosure: I am obliged to inform you that I, as well as my advisory clients, own some of the ETFs listed in the above table. Furthermore, they do not represent a specific investment recommendation for you, they merely show which ETFs from the universe I track are falling within the specified guidelines.
Contact Ulli