
ETF Tracker StatSheet
You can view the latest version here.
A GLOOMY JOBS REPORT PENALIZES EQUITIES
- Moving the markets
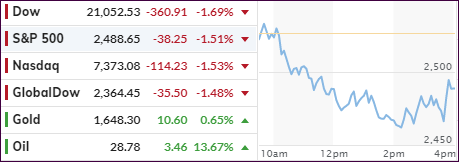
It could have been a lot worse with equities churning lower today, but thanks to Monday’s surge, the weekly effect was relatively minor with the S&P 500 “only” surrendering a modest -2%, which is tiny when compared to the recent wild rides we’ve seen.
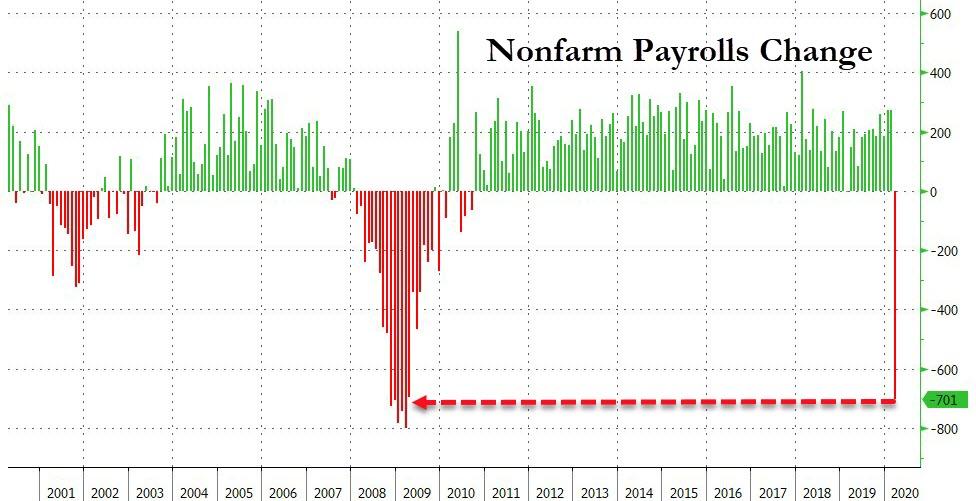
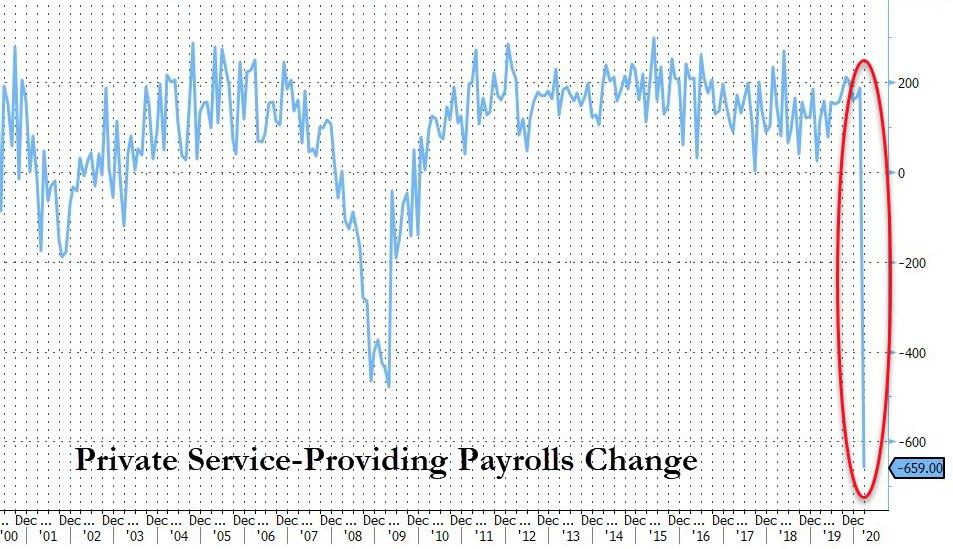
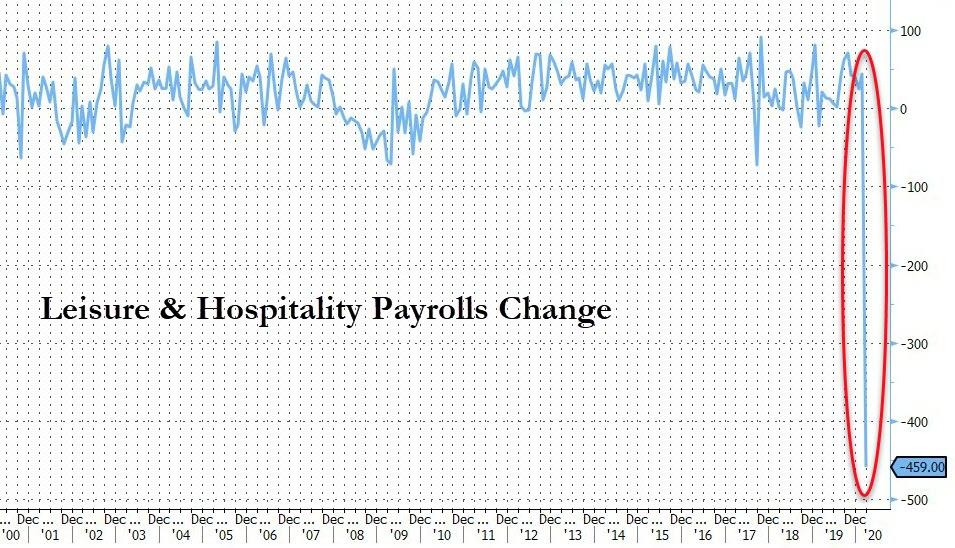
Even the March jobs disaster, as Zero Hedge called it, showed that 701k jobs were lost, while the unemployment rate soared the most in 45 years. As was no surprise, private service and leisure were the hardest hit areas.
Keep in mind, the numbers were much higher, because the survey was taken around March 13 and ahead of the big shutdown and layoff announcements. That means the next set of numbers for April due out in May will indeed be epic, with some analysts forecasting a loss of as many as 10 million jobs.
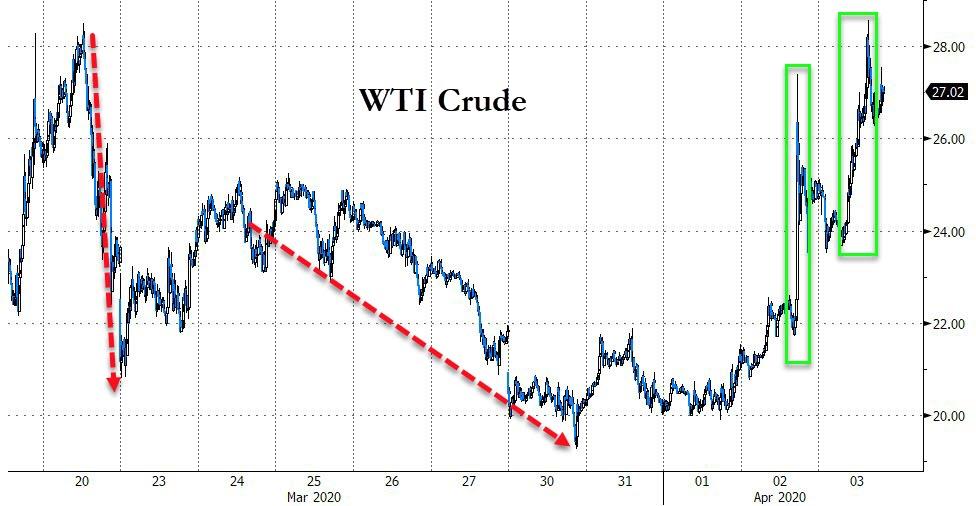
It seems that oil’s recent rally, which continued today, helped support equities to some degree, as hopes of a supply cut sparked the single-biggest daily gain ever and the biggest weekly gain ever in crude oil, as ZH reports. They further summed up the stories of the week this way:
- Helicopter money begins… and the sovereign risk of the USA soars
- Oil has best week ever on hopes of supply cut.
- Stocks sink as any rebalance flow support evaporated.
- Lockdown effects are starting to be seen in labor and survey data
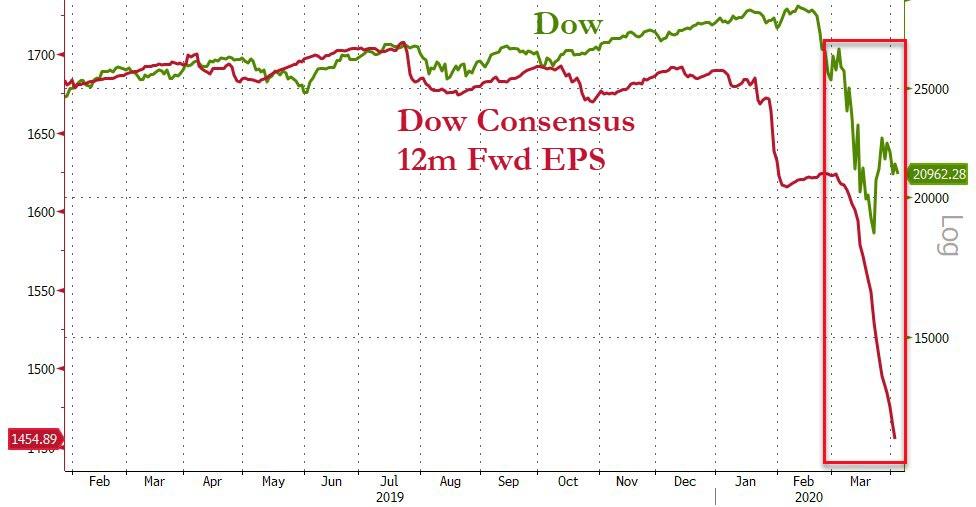
In the end, the major indexes are still hovering at a level inconsistent with underlying fundamentals. In the case of the Dow, forward earnings per share (EPS) would put this index just below the 15k level, as this chart from Bloomberg demonstrates. This translates into a drop of some 30% from current readings.
Who knows if it will get there? However, being in a bear market, you can’t simply discount this possibility.
It’s good to be on the sidelines.
2. ETFs in the Spotlight
In case you missed the announcement and description of this section, you can read it here again.
It features some of the 10 broadly diversified domestic and sector ETFs from my HighVolume list as posted every Saturday. Furthermore, they are screened for the lowest MaxDD% number meaning they have been showing better resistance to temporary sell offs than all others over the past year.
The below table simply demonstrates the magnitude with which these ETFs are fluctuating above or below their respective individual trend lines (%+/-M/A). A break below, represented by a negative number, shows weakness, while a break above, represented by a positive percentage, shows strength.
For hundreds of ETF choices, be sure to reference Thursday’s StatSheet.
For this past domestic “Buy” cycle, which ended on 2/27/2020, here’s how some our candidates have fared:
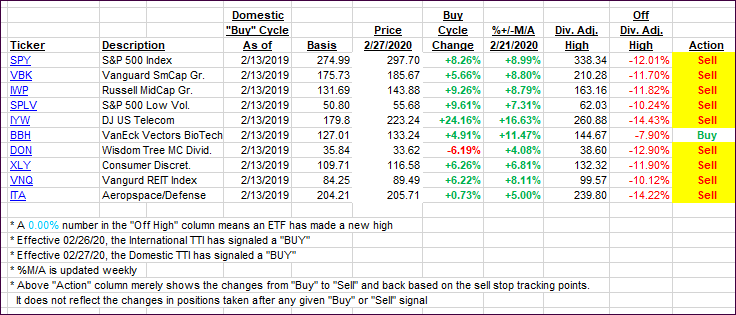
Click image to enlarge
Again, the %+/-M/A column above shows the position of the various ETFs in relation to their respective long-term trend lines, while the trailing sell stops are being tracked in the “Off High” column. The “Action” column will signal a “Sell” once the -8% point has been taken out in the “Off High” column. For more volatile sector ETFs, the trigger point is -10%.
In my advisor practice, we may or may not be invested in some of the 10 ETFs listed above.
3. Trend Tracking Indexes (TTIs)
Our TTIs slipped only a tad, as the major indexes only took a small hit.
Here’s how we closed 04/03/2020:
Domestic TTI: -24.95% below its M/A (prior close -25.39%)—Sell signal effective 02/27/2020
International TTI: -22.02% below its M/A (prior close -22.38%)—Sell signal effective 02/26/2020
Disclosure: I am obliged to inform you that I, as well as my advisory clients, own some of the ETFs listed in the above table. Furthermore, they do not represent a specific investment recommendation for you, they merely show which ETFs from the universe I track are falling within the specified guidelines.
———————————————————-
WOULD YOU LIKE TO HAVE YOUR INVESTMENTS PROFESSIONALLY MANAGED?
Do you have the time to follow our investment plans yourself? If you are a busy professional who would like to have his portfolio managed using our methodology, please contact me directly or get more details here.
———————————————————
Back issues of the ETF Tracker are available on the web.
Contact Ulli