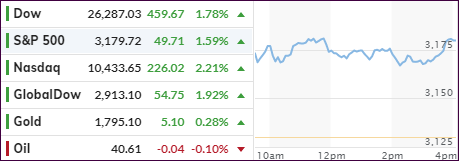
The major indexes greeted the first full week of July with a bang after the 3-day Holiday weekend, during which we were bombarded with news of more outbreaks of the coronavirus everywhere, as well as mass shootings.
None of that mattered this morning, as the bullish theme prevailed right after the opening bell rang with the major indexes pumping higher. A late-session breather was just that and, as we’ve seen quite a bit lately, during the last 30 minutes waves of buying pulled the major indexes out of that temporary lull.
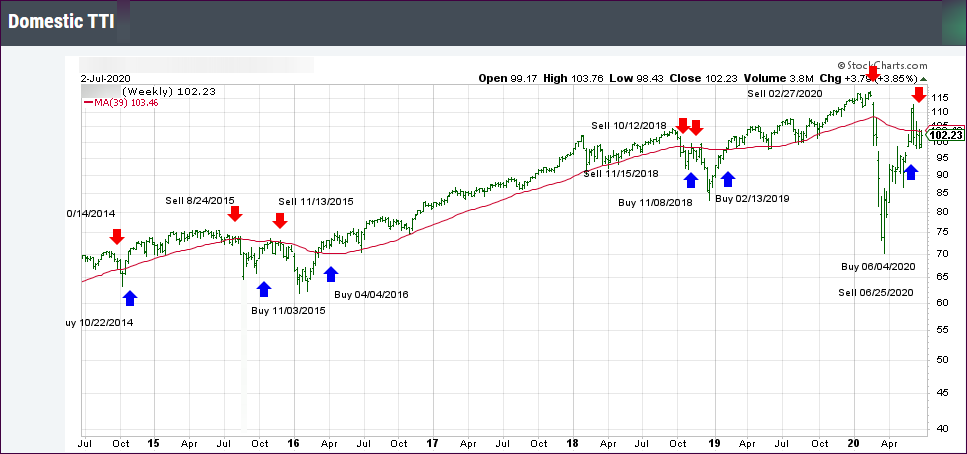
In my advisor practice, I increased our holdings in those areas that run on their own cycles and are not dependent on the TTI signals. However, intra-day, the Domestic TTI briefly broke its long-term trend line to the upside, but could not hold that advance into the close, thereby leaving that indicator still slightly negative.
The early ramp started in the Chinese markets (+7%), followed by Europe with the US also following along, despite increasing doubts about the ability to not only contain the virus outbreak but also the resulting economic fallout.
Right now, the bulls are clearly in charge, with tech remaining the front runner, and we will follow the various trends subject to our trailing sell stops.
Below, please find the latest High-Volume ETF Cutline report, which shows how far above or below their respective long-term trend lines (39-week SMA) my currently tracked ETFs are positioned.
This report covers the HV ETF Master List from Thursday’s StatSheet and includes 312 High Volume ETFs, defined as those with an average daily volume of more than $5 million, of which currently 138 (last week 97) are hovering in bullish territory. The yellow line separates those ETFs that are positioned above their trend line (%M/A) from those that have dropped below it.
In case you are not familiar with some of the terminology used in the reports, please read the Glossary of Terms. If you missed the original post about the Cutline approach, you can read it here.
1. From the universe of over 1,800 ETFs, I have selected only those with a trading volume of over $5 million per day (HV ETFs), so that liquidity and a small bid/ask spread are assured.
2. Trend Tracking Indexes (TTIs)
Buy or Sell decisions for Domestic and International ETFs (section 1 and 2), are made based on the respective TTI and its position either above or below its long-term M/A (Moving Average). A crossing of the trend line from below accompanied by some staying power above constitutes a “Buy” signal. Conversely, a clear break below the line constitutes a “Sell” signal. Additionally, I use a 7.5% trailing stop loss on all positions in these categories to control downside risk.
3. All other investment arenas do not have a TTI and should be traded based on the position of the individual ETF relative to its own respective trend line (%M/A). That’s why those signals are referred to as a “Selective Buy.” In other words, if an ETF crosses its own trendline to the upside, a “Buy” signal is generated. Since these areas tend to be more volatile, I recommend a wider trailing sell stop of 7.5% -10% depending on your risk tolerance.
If you are unfamiliar with some of the terminology, please see Glossary of Termsand new subscriber information in section 9.
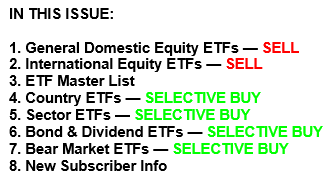
1. DOMESTIC EQUITY ETFs: SELL— since 06/25/2020
Click on chart to enlarge
Our main directional indicator, the Domestic Trend Tracking Index (TTI-green line in the above chart) has now dropped below its long-term trend line (red) by -1.19% and has generated a new Domestic “Sell” signal effective 06/25/20 as posted.
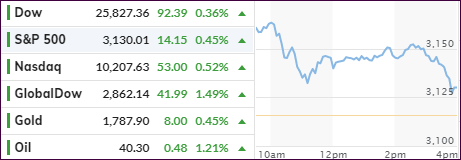
An early 400-point rally in the Dow bit the dust, as the major indexes faded towards the close but managed to end up in the green for the 4th session in a row.
Driving the initial gains were better than expected employment numbers of 4.8 million new jobs in June created vs. expectations for a 3.7 million rise, but this euphoric reaction may already be decelerating, as renewed surges of the coronavirus are causing shutdowns and subsequent layoffs.
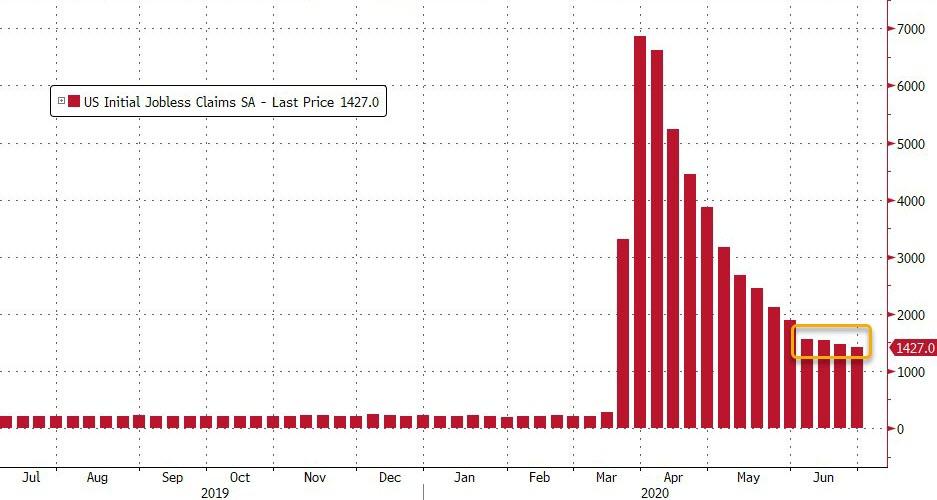
All of this exuberance could be offset by continued initial unemployment claims with the latest print showing 1.427 million new claims in the last week (above the 1.35 million expected). The chart shows that we saw some 6 million of new claims in June, which means, with only 4.8 million new jobs created, the employment numbers show no improvement at all.
But that does not matter, what matters is that the computer algos interpreted today’s numbers as a positive, and up we went.
Nothing seems real anymore, and as Global Macro Monitor reported, Larry Lindsey, the former director of the National Economic Council, came out this morning making a market call of 4,000 for the S&P 500 by the end of next year:
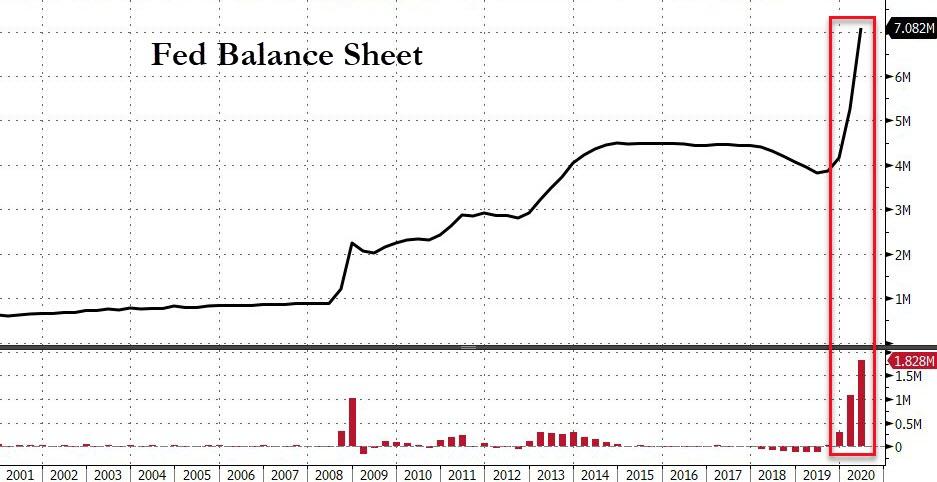
“…I just did some math on what is happening to the money supply…when you have a rapid expansion of the Fed’s balance sheet that the main effect is on asset prices….so I simply do the extrapolation…of what might be expected to happen in stock prices.” – Lawrence Lindsey
Ranted the Macro Monitor:
There you have it, folks, a forecast of the creation of more than $7 trillion of wealth over the next 18 months based, not on productivity gains, innovation, nor economic growth, but by keeping the digital printing press running.
Whether the wealth is real at the end of 2021 will depend on the purchasing power of the dollar, which we suspect will be lower than most currently expect.
At the end of this Holiday shortened week, the equities had their best week in 3 months, and that in the face of mounting Covid-19 comeback concerns, with many states continuing to reduce their business activity.
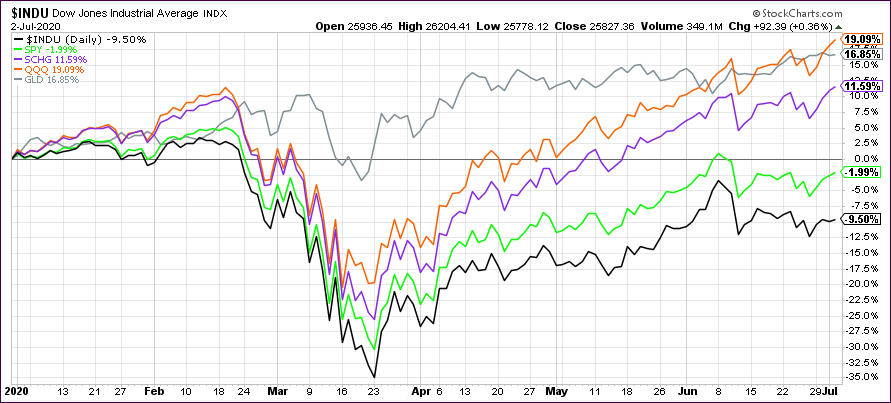
Despite all that, gold remains one of the best-performing asset classes YTD, but it looks like the Nasdaq just caught up today, while the Dow remains the laggard with -9.50%:
I will post the updated StatSheet this evening and the weekly Cutline report tomorrow.
Despite overnight weakness in the futures markets, positive momentum got restored on predominantly bad news, and the major indexes finished a volatile session in the green. The exception was the Dow, which hovered around its unchanged line before diving into the red at the close.
The early pump was based on another “positive” vaccine headline this time from Pfizer, which sent US equities soaring, because now the virus problem is resolved. Of course, I am being facetious here, but how else can you react to “medical results by press release,” as ZH put it:
In all 24 subjects who received 2 vaccinations at 10 µg and 30 µg dose levels of BNT162b1, elevation of RBD-binding IgG concentrations was observed after the second injection with respective GMCs of 4,813 and 27,872 units/ml at day 28, seven days after immunization. These concentrations are 8- and 46.3-times the GMC of 602 units/ml in a panel of 38 sera from subjects who had contracted SARS-CoV-2.
Hmm, 24 test subjects? I certainly would not feel comfortable being number 25, would you?
ZH summed up the items of interest, which “contributed” to today’s rally:
Pennsylvania 4th state to see record jump in COVID-19 cases
North Carolina reports record jump in COVID-19 cases
Cali orders 19 counties to close
Trump does U-turn on masks
California orders 19 counties including LA to close restaurants dining for 3 weeks
Apple closes another 30 stores
Atlanta Airport closes
California reports another record jump
Houston ICUS at 102% capacity
Nevada reports third-highest daily total yet
NY releases Wednesday numbers
Arizona reports another record daily case count
NYC delays return of indoor dining
Florida reports daily cases for last 24 hours
Goldman says 40% of US has rolled back economic reopening or put them on hold
Oxford scientist warns vaccine by end of year far from guaranteed
Pfizer vaccine headline sends futures higher
US reported 48k+ new cases yesterday
Australia locks down 300k in Victoria
Brazil imposes travel ban as deaths near 60k
Tokyo reports most cases since state of emergency lifted
German infection rate below R for 7th day
All of the above drove the markets with the Nasdaq scoring a new record high. The loser for the day was gold due to the prevailing opinion that that risk is back on and who needs protection.
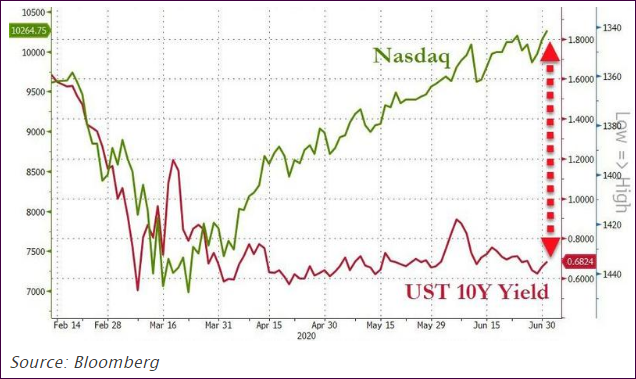
The bond/stock divergence continues full force, prompting ZH to ask the all-important question:
Will this divergence re-couple? And if so, will it be stocks or bonds that are sold?
On the last day of the quarter, bullish sentiment shifted into overdrive following the widely held theme of the past 90 days, that a V-shape recovery is in the cards.
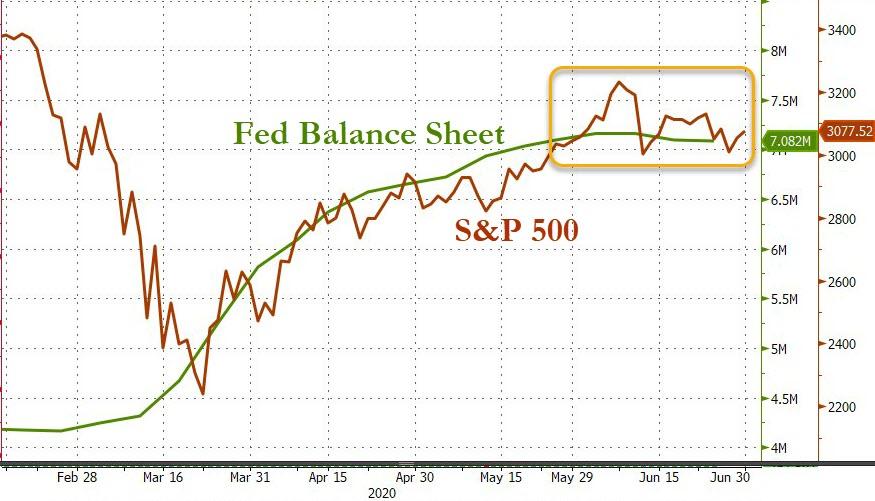
Of course, this rebound off the March lows has nothing to do with economic progress but everything with the Fed’s reckless money printing efforts with some $3 trillion finding its way into the markets, which rode the liquidity train with utter abandon.
However, this latest 2-day levitation managed to not only wipe out last Friday’s losses but also threw another big assist to those Buy-and-holders, who toughed it out by being fully invested during the last quarter.
The headline propaganda of this having been the best quarter in about 20 years reminds me of the gambler, who only talks about his gains and never his losses.
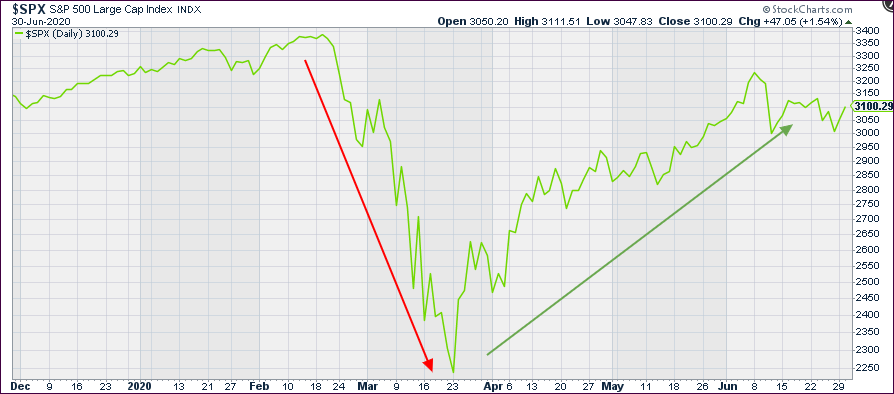
Here’s the S&P 500 chart showing clearly that this quarter only served to make up losses and not create any gains when looking at the year 2020:
As you can see, the rebound was truly impressive, thanks to the Fed’s balance sheet explosion, but it merely bailed out those that were stuck holding on to their portfolios. For sure, there were some gutsy speculators, who had the nerve to try to catch this falling knife along the crash, so, congrats to them. They got lucky this time.
Most of today’s attention went to joint testimony from Mnuchin and Powell, which MarketWatch summarized like this:
Mnuchin said the Treasury and Fed were looking at extending the Fed’s established 11 emergency lending facilities, but also reiterated that additional types of COVID-19 aid likely will need to be addressed by Congress under the next phase of stimulus.
The Fed’s Powell stressed that the ‘overriding goal’ of the central bank’s facilities is to help get the roughly 25 million workers who lost jobs during the pandemic back to work, while also warning that the worst part of a second wave of COVID-19 infections would be if it undermines consumer confidence.
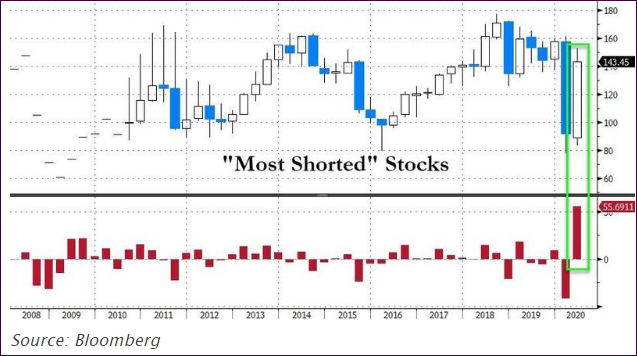
Of course, giving a huge assist to the bulls in Q2, was the biggest short squeeze ever, as ZeroHedge pointed to in this chart:
The question is will this continue or not? For sure, our Trend Tracking Indexes (TTIs) made up some lost ground from last week, but it will take another push to generate a new “Buy.”
Usually, after the quarter-ending window dressing is over, we may see a pullback, the severity of which will depend on the latest Covid-19 news followed by earnings announcements within the next two weeks.
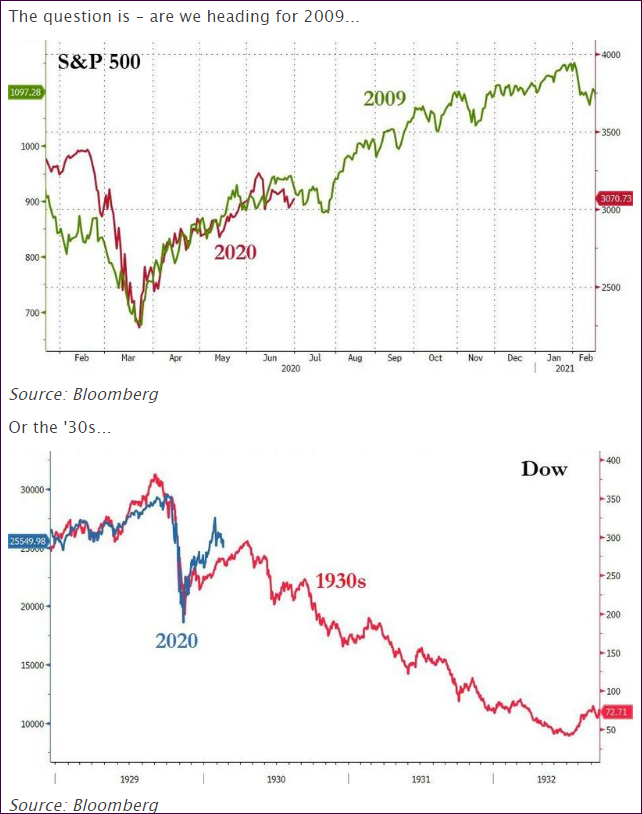
I enjoy looking at historical chart overlays depicting potentially opposite outcomes. ZH presented it like this:
