
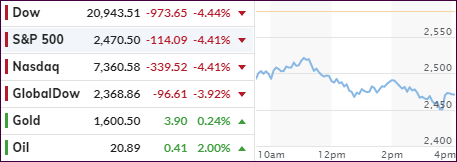
- Moving the markets
As the worst quarter in history came to an end with a sell-off, the 2nd quarter started with a bang—but to the downside, leaving the always optimistic Wall Street players gasping. As Barron’s commented, today was the worst first day of a quarter—ever. That’s a lot of “worsts,” and they erased some 50% of last week’s dead-cat-bounce.
Today, there simply was no bullish meat found on that ageing carcass, with the major indexes spending the entire session below their respective unchanged lines giving the bears an easy victory, as any rally attempts ran into a brick wall of selling.
For sure, not helping matters was Trump’s warning that a “very, very painful” two weeks lie ahead, as we continue to face the rapidly spreading coronavirus epidemic. That indicates that many businesses will remain shut down for at least that period, but I think that timeframe will be extended.
It is now clear that the world’s economies have been and are experiencing a never seen before interruption to industries, small businesses and households, even far worse than what we saw in 2008. The hope that a V-shape type of recovery will be in our near future may not happen, if this shutdown extends for any length of time past the month of April.
Last week’s bullish driver, namely the quarter-end rebalancing act, is now spent and in the rear-view mirror. Another major player that has heavily contributed to the bullish theme over the past few years, corporate buybacks, have disappeared as well with companies having more serious issues than manipulating their stock price via the buyback game.
That leaves economic data, and possibly the Plunge Protection Team (PPP), to offer market support, the power of either is questionable given current circumstances.
No, I am not being negative. I see a light at the end of the tunnel, the tunnel is just much longer than most anticipate.
2. ETFs in the Spotlight
In case you missed the announcement and description of this section, you can read it here again.
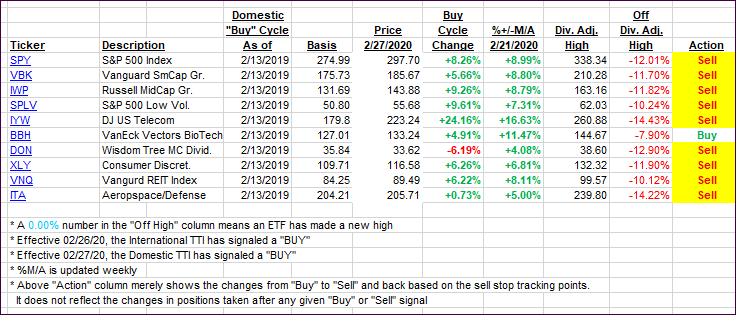
It features some of the 10 broadly diversified domestic and sector ETFs from my HighVolume list as posted every Saturday. Furthermore, they are screened for the lowest MaxDD% number meaning they have been showing better resistance to temporary sell offs than all others over the past year.
The below table simply demonstrates the magnitude with which these ETFs are fluctuating above or below their respective individual trend lines (%+/-M/A). A break below, represented by a negative number, shows weakness, while a break above, represented by a positive percentage, shows strength.
For hundreds of ETF choices, be sure to reference Thursday’s StatSheet.
For this past domestic “Buy” cycle, which ended on 2/27/2020, here’s how some our candidates have fared:
Click image to enlarge
Again, the %+/-M/A column above shows the position of the various ETFs in relation to their respective long-term trend lines, while the trailing sell stops are being tracked in the “Off High” column. The “Action” column will signal a “Sell” once the -8% point has been taken out in the “Off High” column. For more volatile sector ETFs, the trigger point is -10%.
In my advisor practice, we may or may not be invested in some of the 10 ETFs listed above.
3. Trend Tracking Indexes (TTIs)
Our TTIs headed deeper into bear market territory, as the major indexes got clobbered.
Here’s how we closed 04/01/2020:
Domestic TTI: -25.39% below its M/A (prior close -21.53%)—Sell signal effective 02/27/2020
International TTI: -22.38% below its M/A (prior close -19.07%)—Sell signal effective 02/26/2020
Disclosure: I am obliged to inform you that I, as well as my advisory clients, own some of the ETFs listed in the above table. Furthermore, they do not represent a specific investment recommendation for you, they merely show which ETFs from the universe I track are falling within the specified guidelines.
Contact Ulli