Running Into Overhead Resistance

Ulli Uncategorized Contact

[Chart courtesy of MarketWatch.com]

  1. Moving the markets

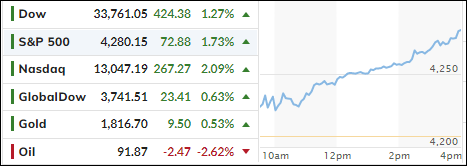
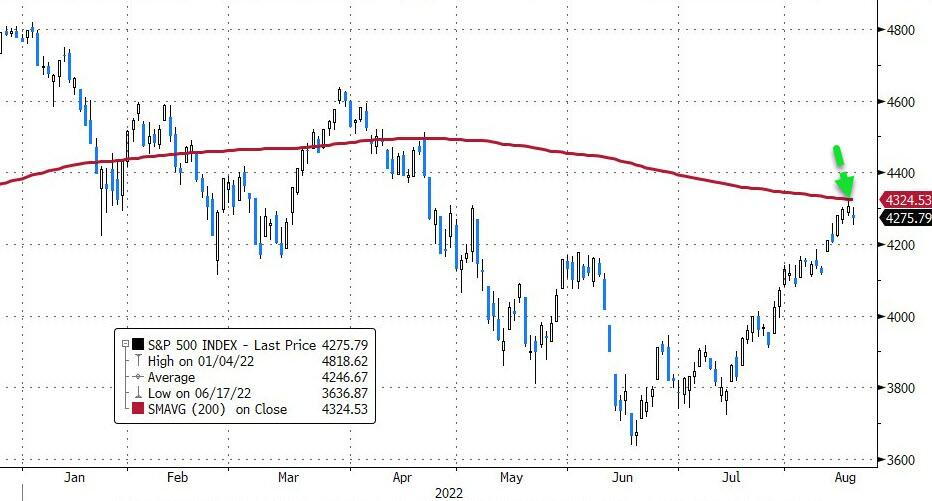
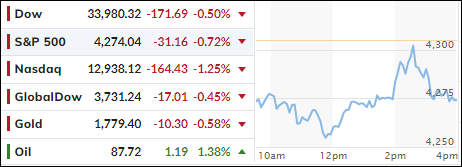
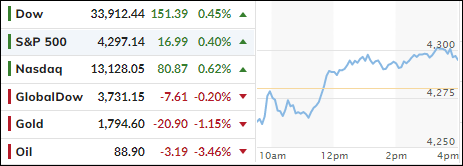
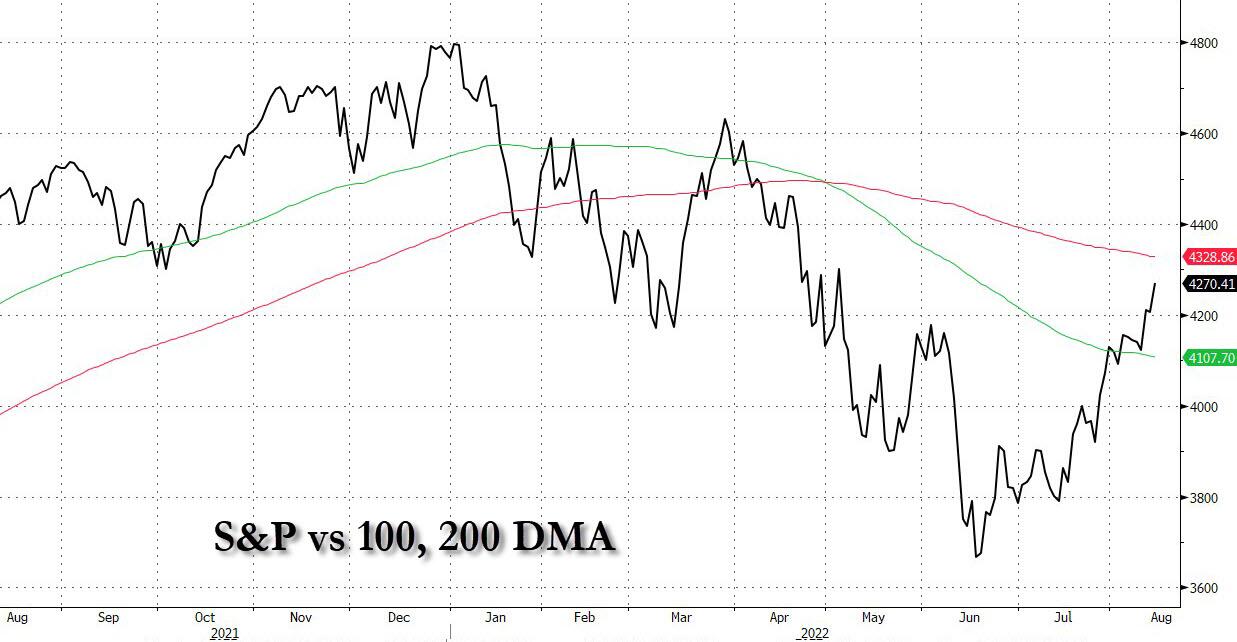
A few items kept traders in a defensive position with overhead resistance lurking due to the S&P 500 approaching its 200-day M/A, a level that is often associated with a major trend change. Historically, these attempts have not played out well for the bulls, as this chart shows.

The other issues for traders’ non-committal behavior were the latest retail sales data, which stalled in July, as Target slipped due to excess inventory, while Lowe’s traded higher despite a questionable quarter.

That was followed by investors’ assessment of the Fed’s latest FOMC minutes, which again confirmed what many of the Fed’s mouth pieces have opined on, namely that their policy remains aggressive regarding hiking rates until it can subdue inflation.

But, to make the issue more confusing, the Central Bank also indicated that it could soon slow the speed of its tightening, while also acknowledging the dire strait of the economy and risk to the downside for GDP growth, as quoted by MarketWatch.

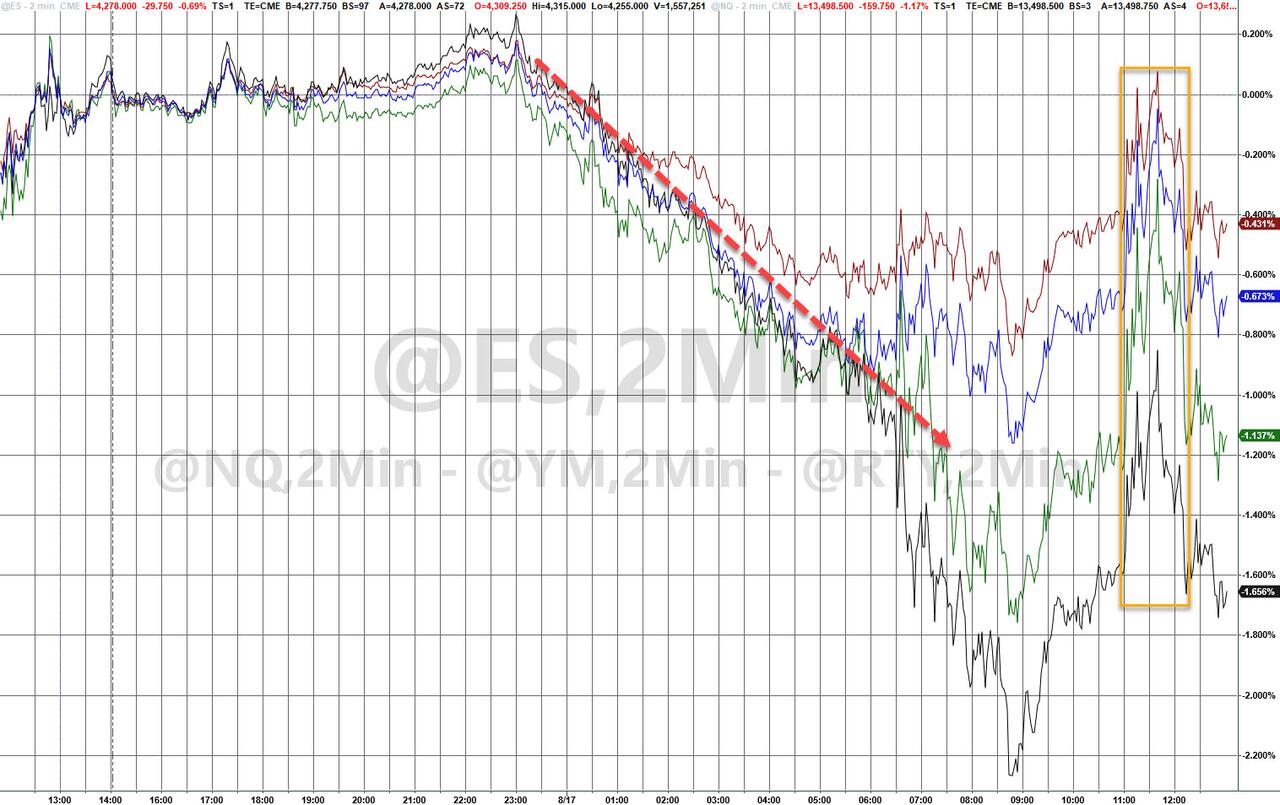
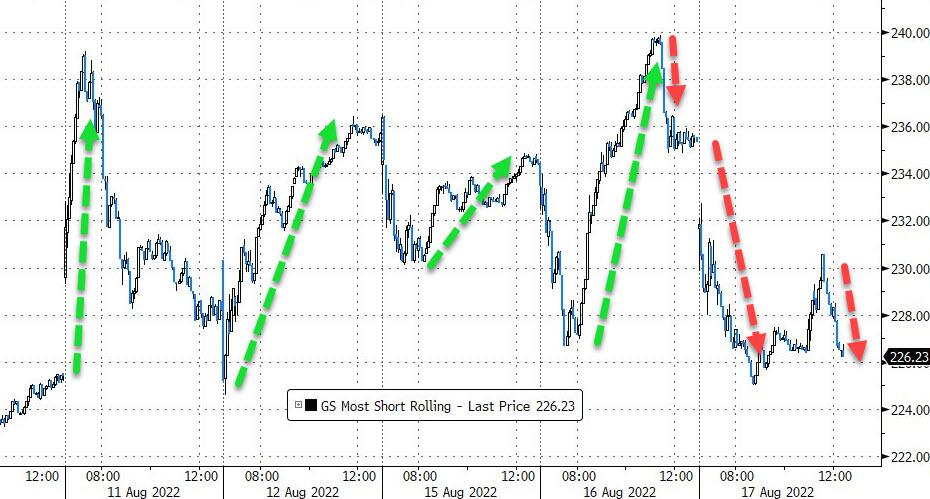
There you have it. The Fed has no clue what’s next and has conveniently covered both possibilities. This left the market in a state of confusion and allowed the bears to score a win for the first day in six, as the usual short squeeze simply ran out of ammo.

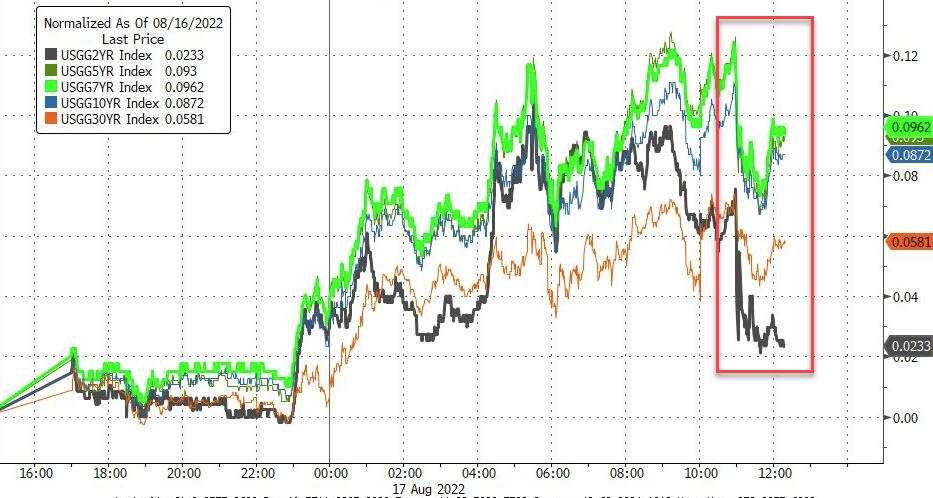
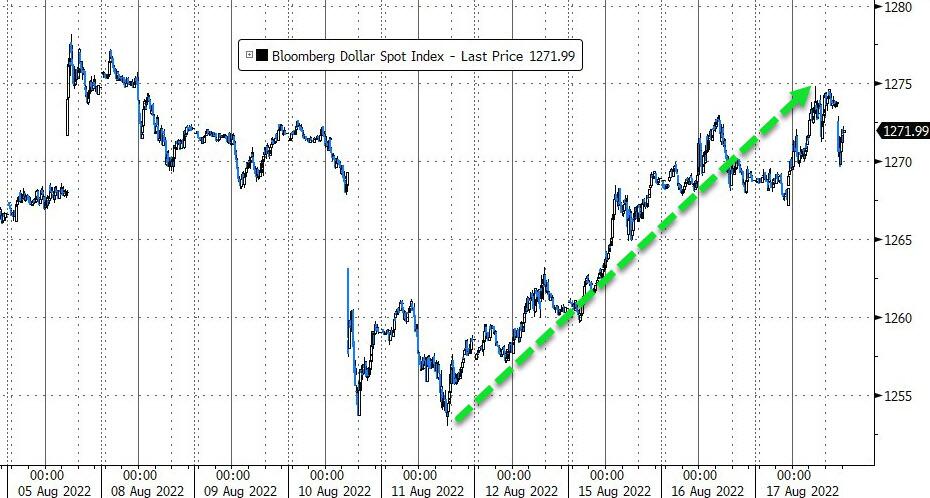
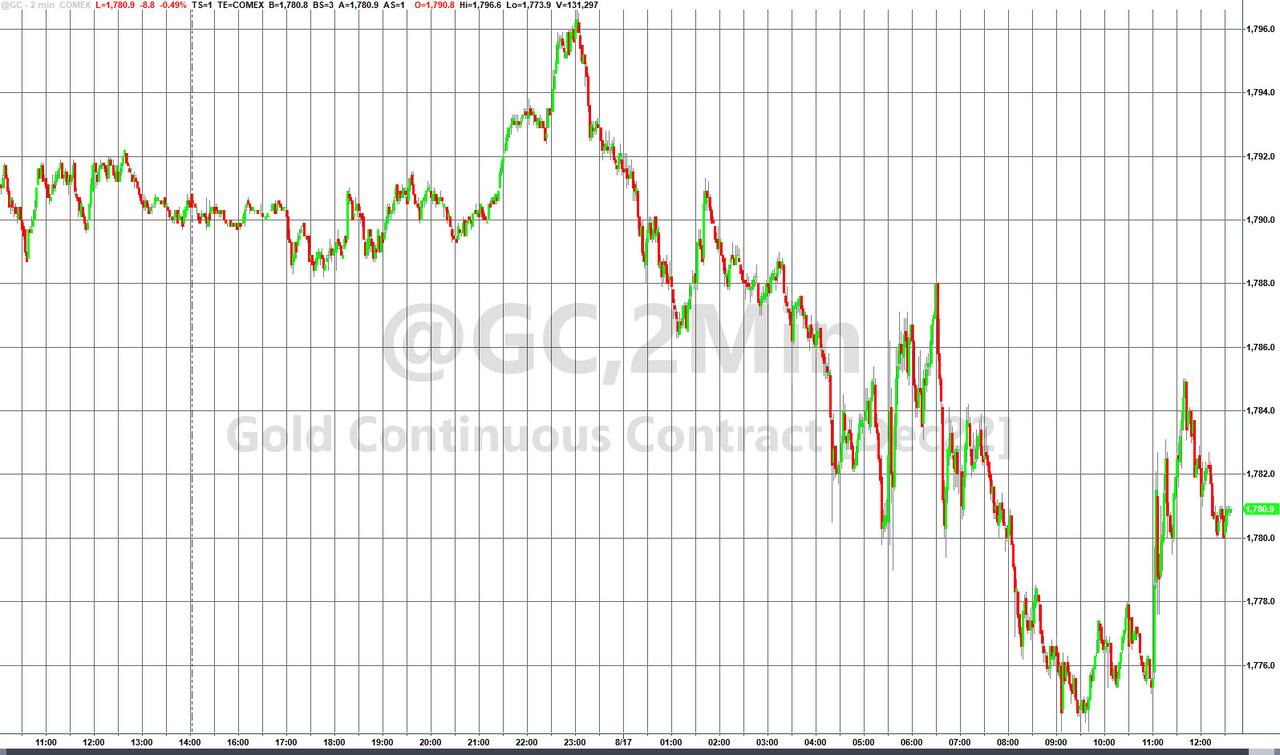
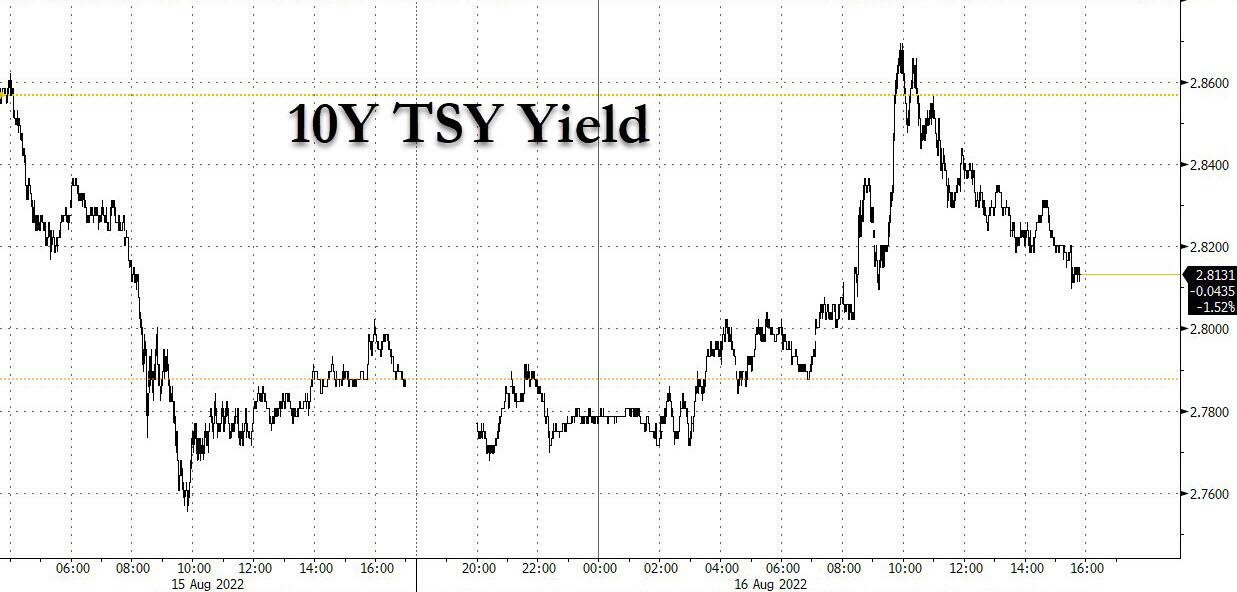
Bond yields rose with the 10-year now it hot pursuit of its 3% level, but its 100-day M/A acted as a strong resistance level. The US Dollar built on recent gains and closed higher, while gold lost its $1,800 level again.

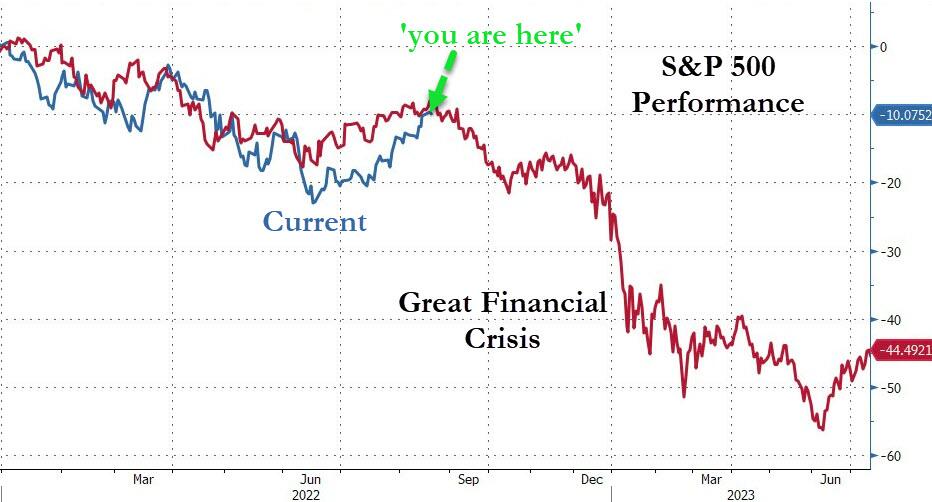
Brace for impact is how ZeroHedge closed its commentary with a new comparison of where the S&P 500 sits now compared to the Great Financial Crises in 2008.  

Will history repeat itself?

Read More
Gingerly Advancing

Ulli Market Commentary Contact

[Chart courtesy of MarketWatch.com]

  1. Moving the markets

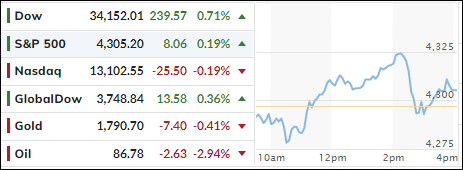
Despite the Dow setting the bullish pace early on, the S&P 500 and Nasdaq struggled through the session by bouncing above and below their respective trend lines, with the former eking out a small gain and the latter falling short of it.

The Dow benefitted from earnings results of Walmart and Home Depot, which seemed to indicate that, at least for the time being, consumer spending might remain strong enough to avoid tipping the economy into a recession. On deck tomorrow are Target and Lowe’s with their earnings, with more retailers to come.

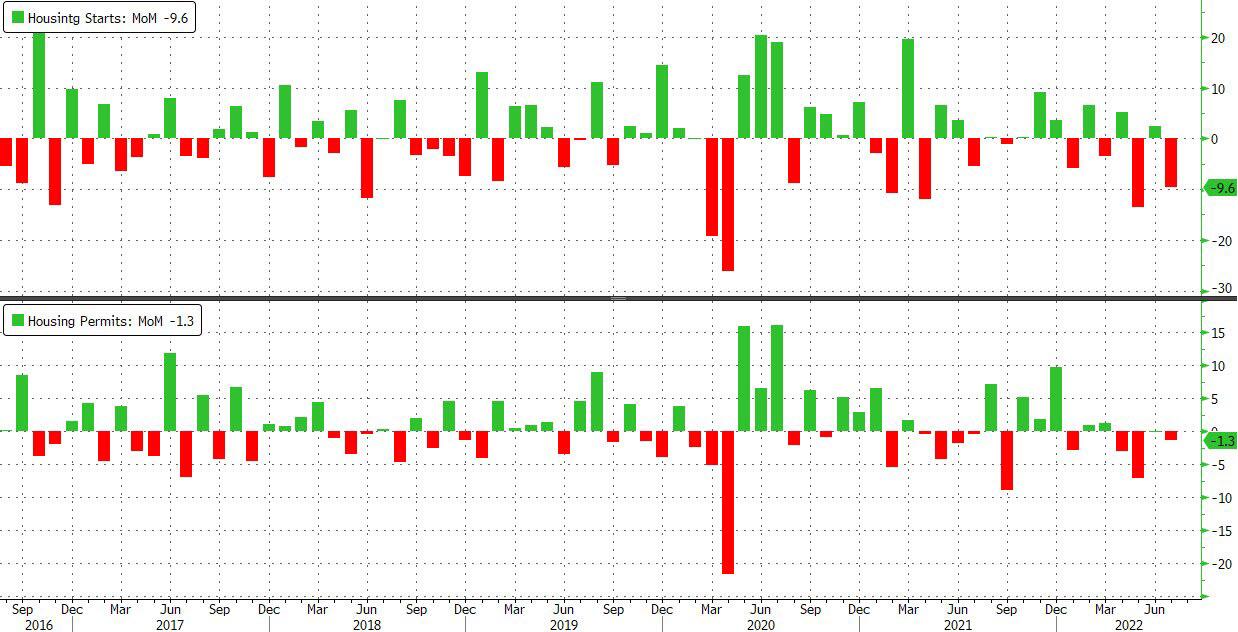
On the economic front, we learned that the real estate market has been hit hard considering surging layoffs, a collapse in Homebuilder Sentiment, soaring mortgage rates, and plunging mortgage applications. One more nail in the coffin appeared today, as Housing Starts simply cratered in July, as ZeroHedge reported.

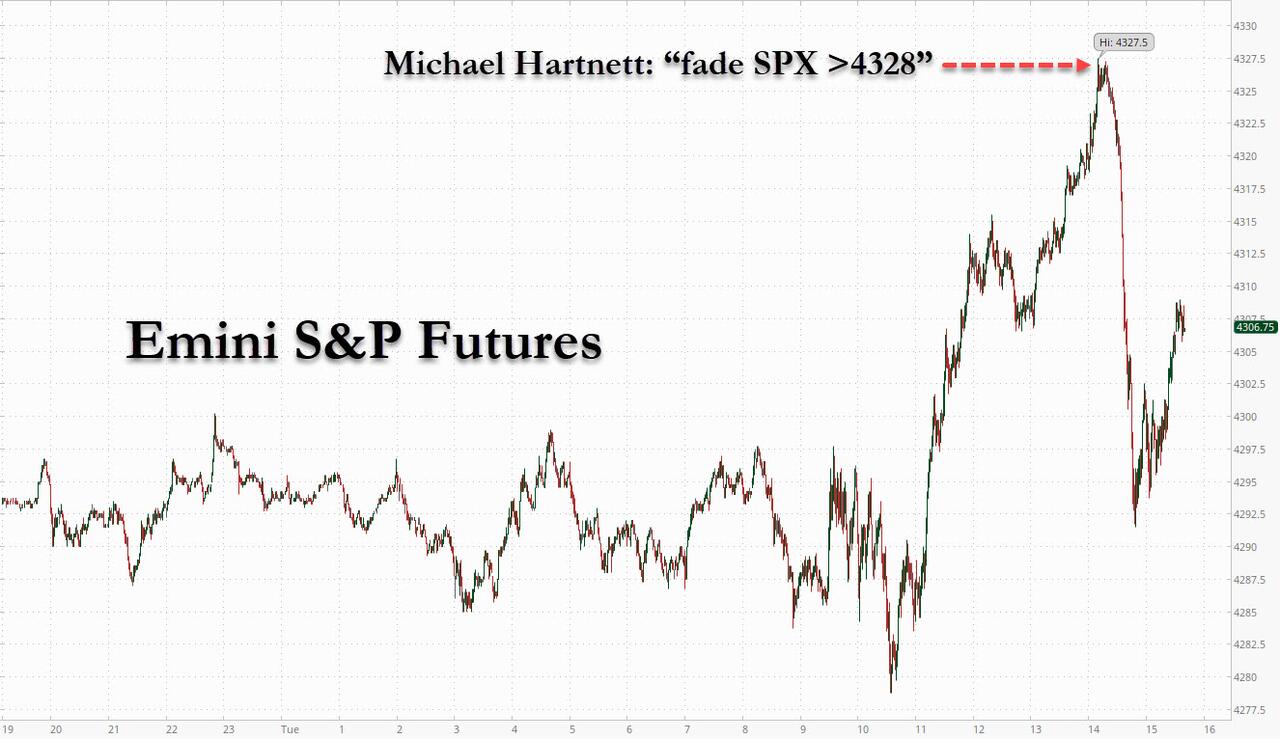
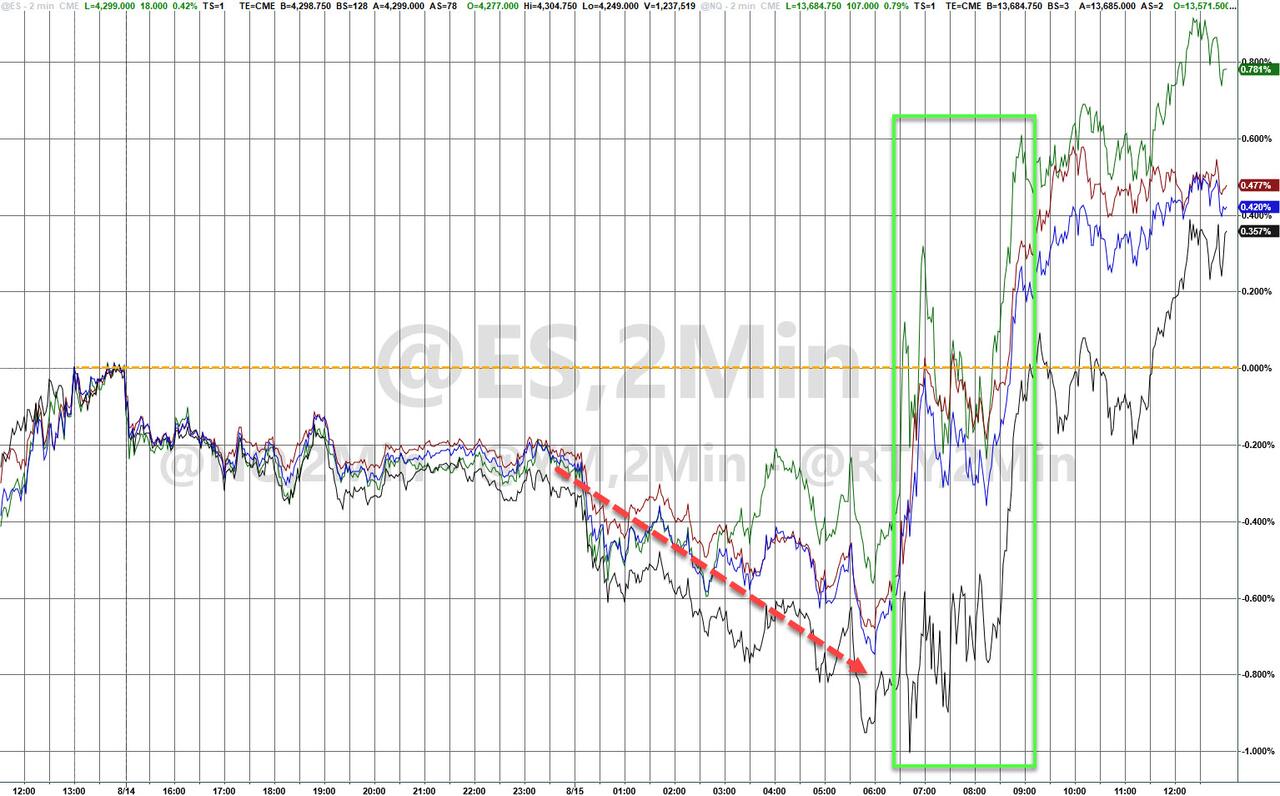
None of that mattered to the markets with bad news simply being ignored, but it seemed that traders were listening to widely followed analyst Michael Hartnett, who may have caused the S&P’s pullback from its highs, as this chart shows.   

Bond yields pumped and dumped but closed the day slightly higher. The US Dollar hugged its unchanged line, while gold remained a tad below its $1,800 level.

Despite the precious metals’ wild swings, YTD, on a buy and hold basis it has done much better than the S&P 500. As of today, gold is down -3.07% vs. the S&P’s -9.71%.

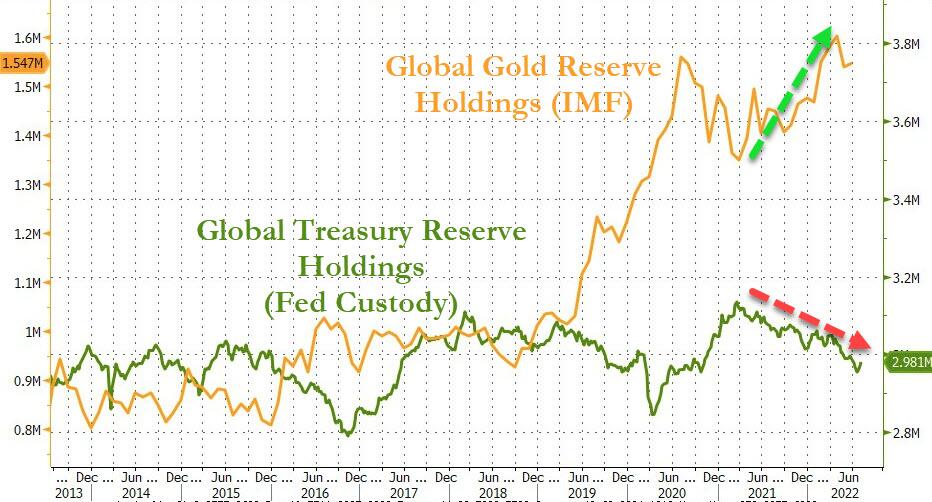
It’s interesting to note, when looking at the big picture, that gold holdings have increased, while Treasury holdings (bonds) have trended lower, as this chart demonstrates.

Hmm…

Read More

Keeping The Bullish Theme Alive

Ulli Market Commentary Contact

[Chart courtesy of MarketWatch.com]

  1. Moving the markets

After a sharp opening drop, led by energy and financials, the major indexes reversed course, dug themselves out of a hole and rallied to a green close.

The rebound came despite disappointing economic data out of China, as their Central Bank out of nowhere decided to cut rates, which seems to indicate that their economic recovery may not be all it’s cracked up to be.

On deck this week, here at home, are a slew of retail earnings from powerhouses like Home Depot, Target, and Walmart, with traders especially homing in on news as to how those businesses have been affected by inflation, and more importantly, what type of forward guidance they will be issuing.

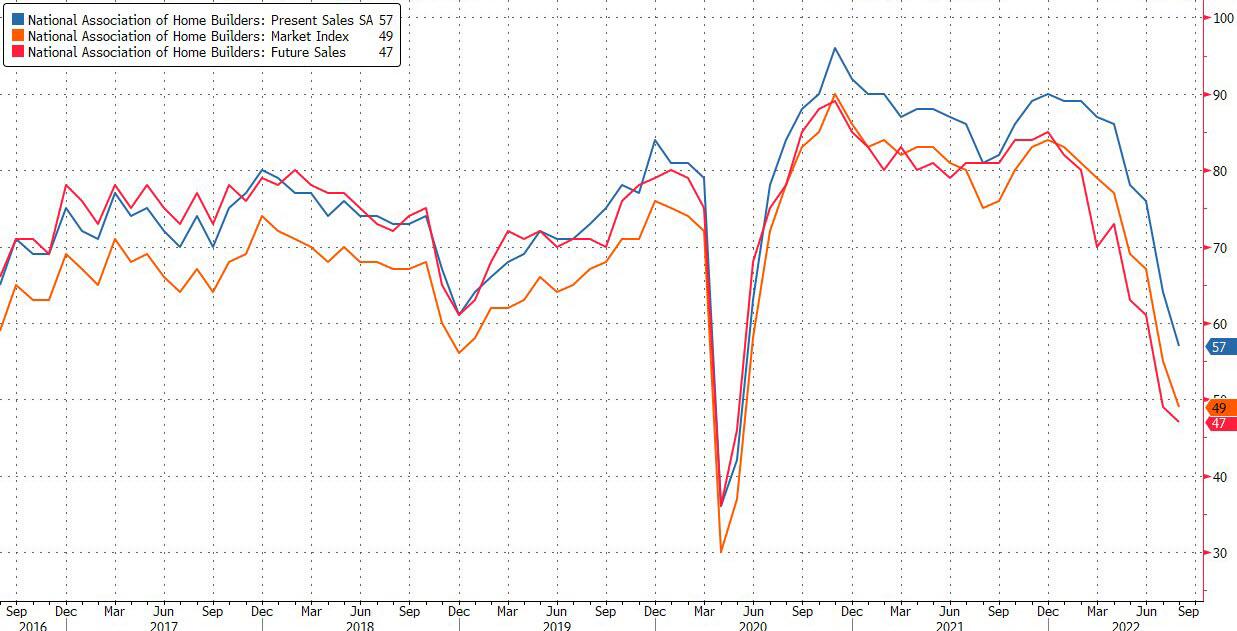
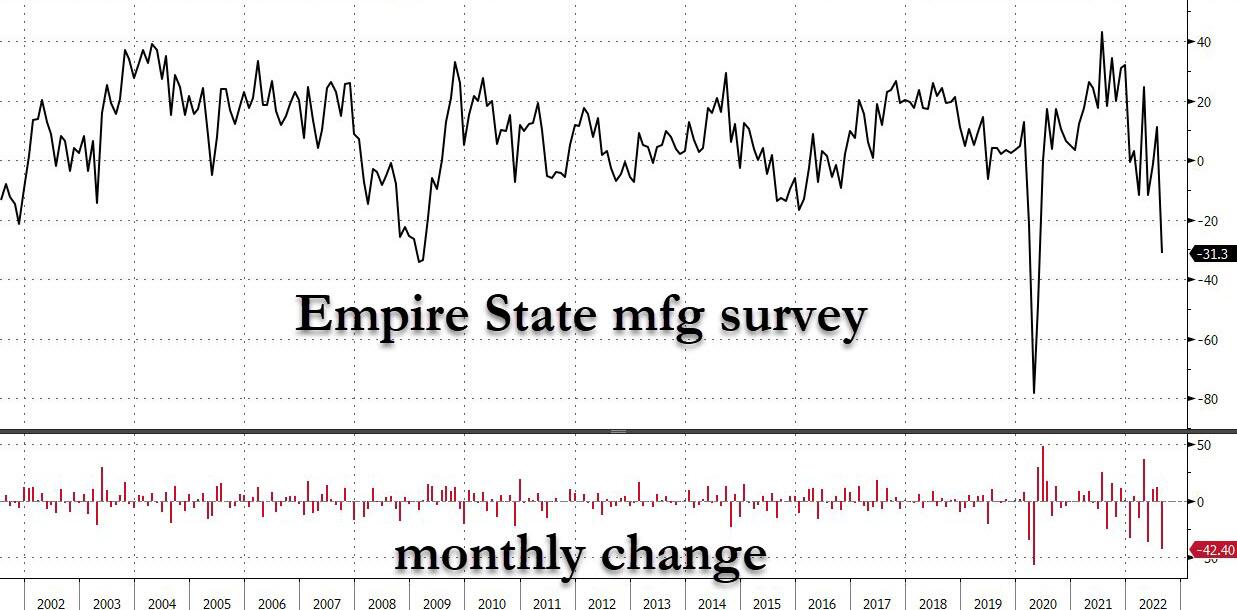
Not helping today’s advance was a thrashing of Homebuilder Confidence, with the index tumbling for the 8th consecutive month, which is its worst slump since the 2007 crash, according to ZeroHedge. The markets also ignored that NY Fed Manufacturing unexpectedly cratered in its second biggest drop on record.

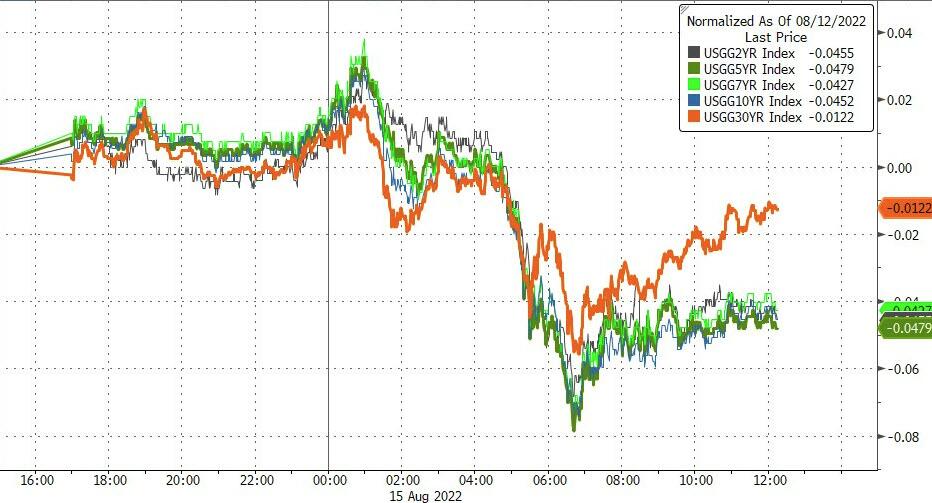
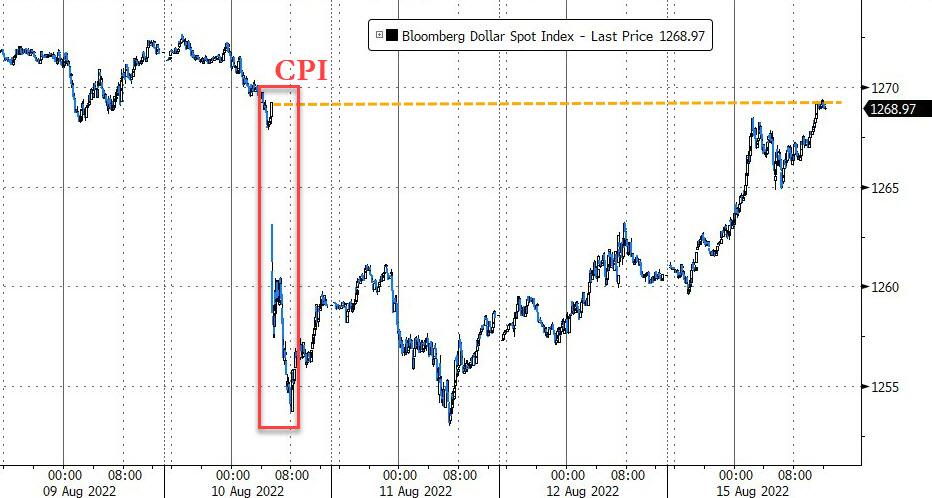
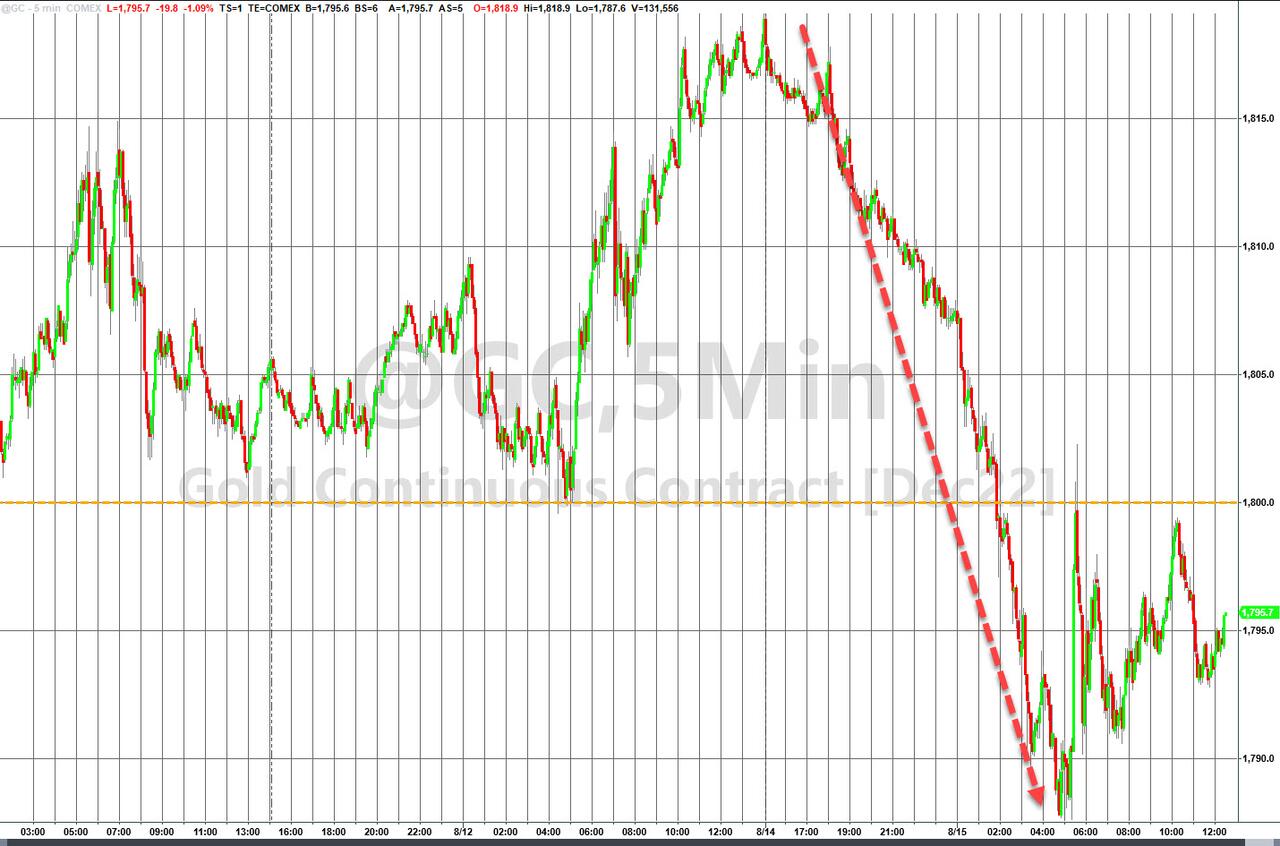
Bond yields dove, The US Dollar retraced its CPI losses, which caused gold to pull back, as the precious metal surrendered its $1,800 level again.

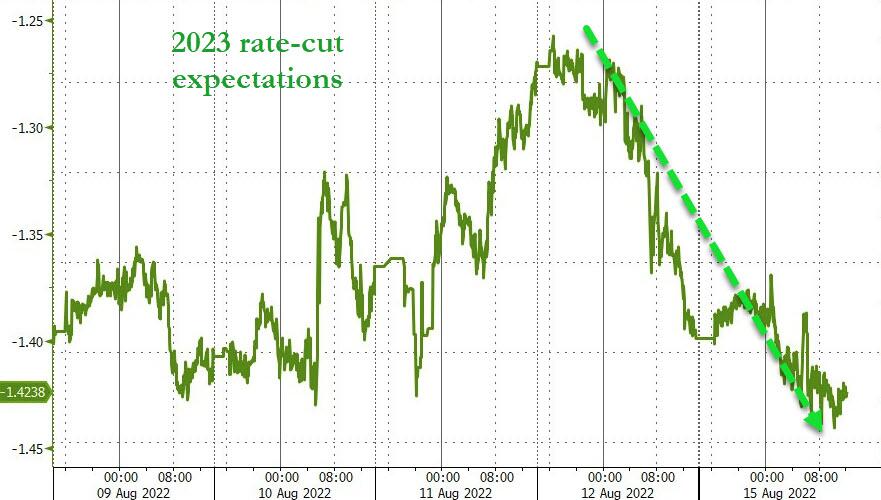
Of course, as we have seen before, all of the bad economic news are a good thing for “easing” (rate cut) expectations, because the up-trend has reversed again, which supports the current bullish theme—but for how long?

Read More
ETFs On The Cutline – Updated Through 08/12/2022

Ulli ETFs on the Cutline Contact

Below, please find the latest High-Volume ETF Cutline report, which shows how far above or below their respective long-term trend lines (39-week SMA) my currently tracked ETFs are positioned.

This report covers the HV ETF Master List from Thursday’s StatSheet and includes 312 High Volume ETFs, defined as those with an average daily volume of more than $5 million, of which currently 99 (last week 36) are hovering in bullish territory. The yellow line separates those ETFs that are positioned above their trend line (%M/A) from those that have dropped below it.

Take a look:                                                                   

The HV ETF Master Cutline Report

In case you are not familiar with some of the terminology used in the reports, please read the Glossary of Terms. If you missed the original post about the Cutline approach, you can read it here.      

ETF Tracker Newsletter For August 12, 2022

Ulli ETF Tracker Contact

ETF Tracker StatSheet          

You can view the latest version here.

DOMESTIC TREND TRACKING INDEX (TTI) CROSSES INTO BULLISH TERRITORY

[Chart courtesy of MarketWatch.com]

  1. Moving the markets

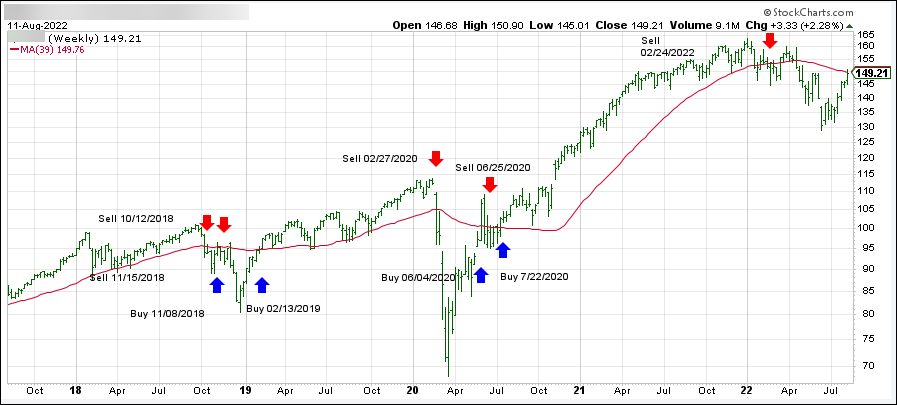
During yesterday’s morning rebound, my proprietary Domestic Trend Tracking Index (TTI) peeked above its long-term trend line into bullish territory. Weakening afternoon momentum pulled the index back below its line, but I took the opportunity to already ease back into the equity market.

Today’s follow through finally pushed the TTI into bullish territory for the first time since our effective “Sell” signal on 2/24/2022. See section 3 below for more details.

This may turn out to be the point in time where a bear market rally morphs into a new bull market with the only question being as to how long this condition will last.

All this positive action, with the S&P 500 now having risen for the fourth straight week, was based on nothing but hope that the Fed will soon have to pivot towards a lowering of the interest rates, as the economy worsens.

Wednesday’s 8.5% CPI reading was heralded as a defining moment, in that we may have already reached peak inflation, an assumption that will turn out to be as wrong as the year long view that inflation was transitory. However, for the time being, traders and algos alike are content riding the bullish bandwagon.

Added ZeroHedge:

Today’s melt up was especially memorable, as it not only cemented the Nasdaq’s new bull market, but sent the broader market up more than 3% for the week, its 4th consecutive week of gains (starting with the week when Powell announced “we’re at neutral”) the longest stretch of gains since November…

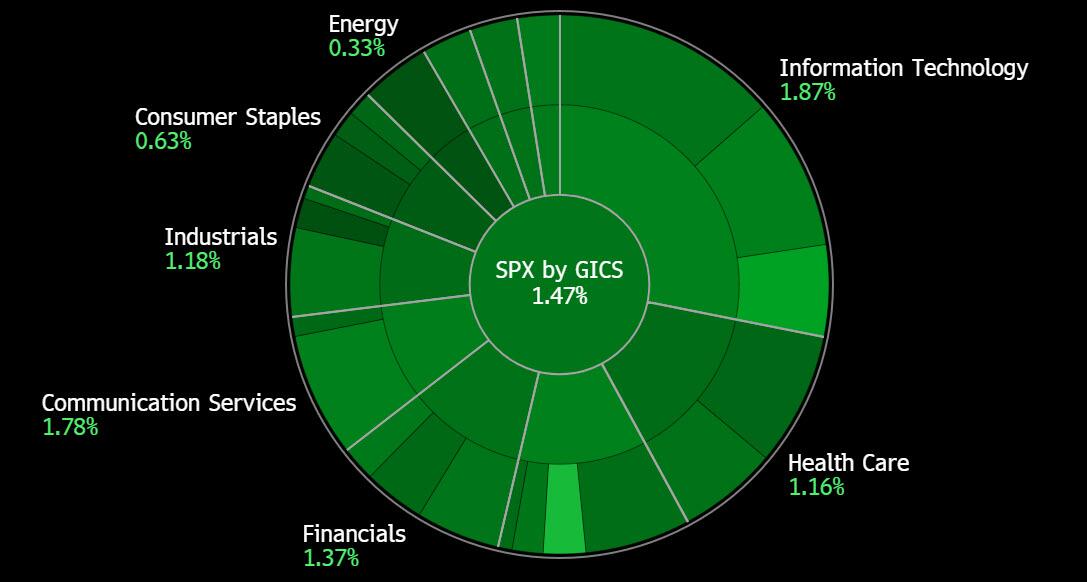
As a result, we saw a sea of green across every sector with SmallCaps as well conquering their long-term trend line. Just as much attention will be given once the S&P 500 crosses its widely followed 200-day M/A, which will only take a gain of about 1.2%.

From a big picture view, ZeroHedge is spot on with this observation:

Yet for all the melt up euphoria, a casual look at what lies ahead brings up storm clouds because unless earnings rebound – and with margins collapsing that’s unlikely – the markets will need to see multiple expansion, which however is unlikely unless real yields drop turn negative again…which however is especially unlikely since the Fed will have to aggressively step in and contain the market’s froth which has undone the tightening from the latest 150bps of Fed rate hikes…

In other words, don’t count on the Fed of not making another hawkish move, or two, something that the various Fed governors have frequently confirmed, as recently as a week ago, but which seems to have been conveniently forgotten.

If you decide to participate in this market, I can only advise you to do so with a clearly defined exit strategy, because we are living in an economic and political environment where things could reverse at a moment’s notice.

Read More

Weekly StatSheet For The ETF Tracker Newsletter – Updated Through 08/11/2022

Ulli ETF StatSheet Contact

ETF Data updated through Thursday, August 11, 2022

Methodology/Use of this StatSheet:

1. From the universe of over 1,800 ETFs, I have selected only those with a trading volume of over $5 million per day (HV ETFs), so that liquidity and a small bid/ask spread are assured.

2. Trend Tracking Indexes (TTIs)

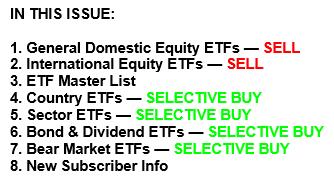
Buy or Sell decisions for Domestic and International ETFs (section 1 and 2), are made based on the respective TTI and its position either above or below its long-term M/A (Moving Average). A crossing of the trend line from below accompanied by some staying power above constitutes a “Buy” signal. Conversely, a clear break below the line constitutes a “Sell” signal. Additionally, I use an 12% trailing stop loss on all positions in these categories to control downside risk.

3. All other investment arenas do not have a TTI and should be traded based on the position of the individual ETF relative to its own respective trend line (%M/A). That’s why those signals are referred to as a “Selective Buy.” In other words, if an ETF crosses its own trendline to the upside, a “Buy” signal is generated. Here too, I recommend trailing sell stop of 12%, or less, depending on your risk tolerance.

If you are unfamiliar with some of the terminology, please see Glossary of Terms and new subscriber information in section 9.     

1. DOMESTIC EQUITY ETFs: SELL — since 02/24/2022

Click on chart to enlarge

Our main directional indicator, the Domestic Trend Tracking Index (TTI-green line in the above chart) has broken below its long-term trend line (red) by -0.54% and remains in “SELL” mode.  

Read More