
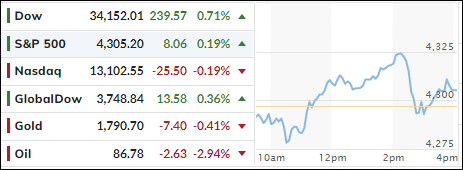
[Chart courtesy of MarketWatch.com]
- Moving the markets
Despite the Dow setting the bullish pace early on, the S&P 500 and Nasdaq struggled through the session by bouncing above and below their respective trend lines, with the former eking out a small gain and the latter falling short of it.
The Dow benefitted from earnings results of Walmart and Home Depot, which seemed to indicate that, at least for the time being, consumer spending might remain strong enough to avoid tipping the economy into a recession. On deck tomorrow are Target and Lowe’s with their earnings, with more retailers to come.
On the economic front, we learned that the real estate market has been hit hard considering surging layoffs, a collapse in Homebuilder Sentiment, soaring mortgage rates, and plunging mortgage applications. One more nail in the coffin appeared today, as Housing Starts simply cratered in July, as ZeroHedge reported.
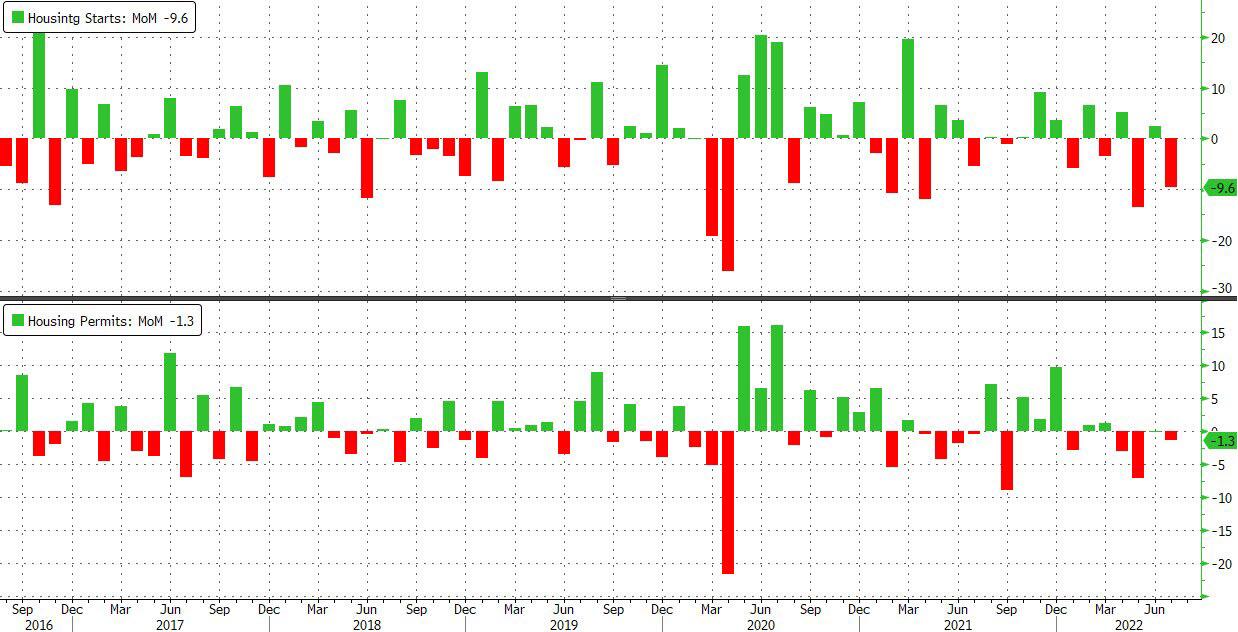
None of that mattered to the markets with bad news simply being ignored, but it seemed that traders were listening to widely followed analyst Michael Hartnett, who may have caused the S&P’s pullback from its highs, as this chart shows.
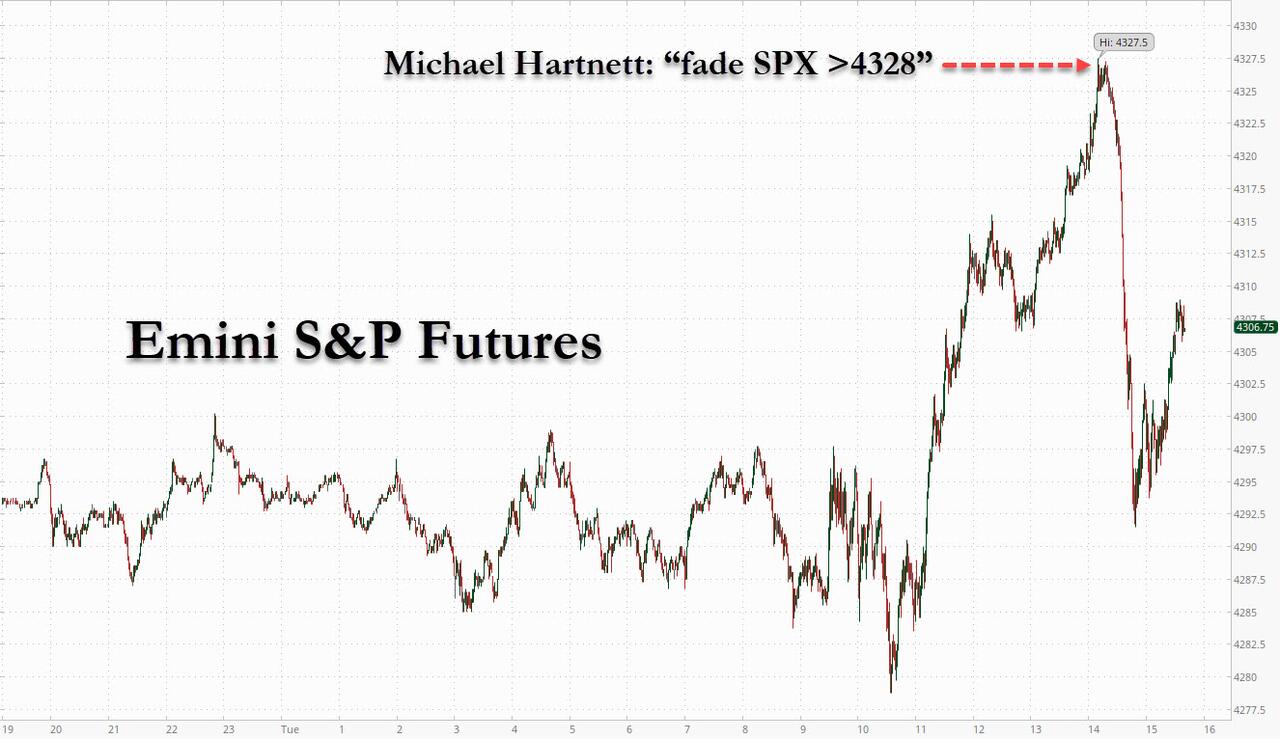
Bond yields pumped and dumped but closed the day slightly higher. The US Dollar hugged its unchanged line, while gold remained a tad below its $1,800 level.
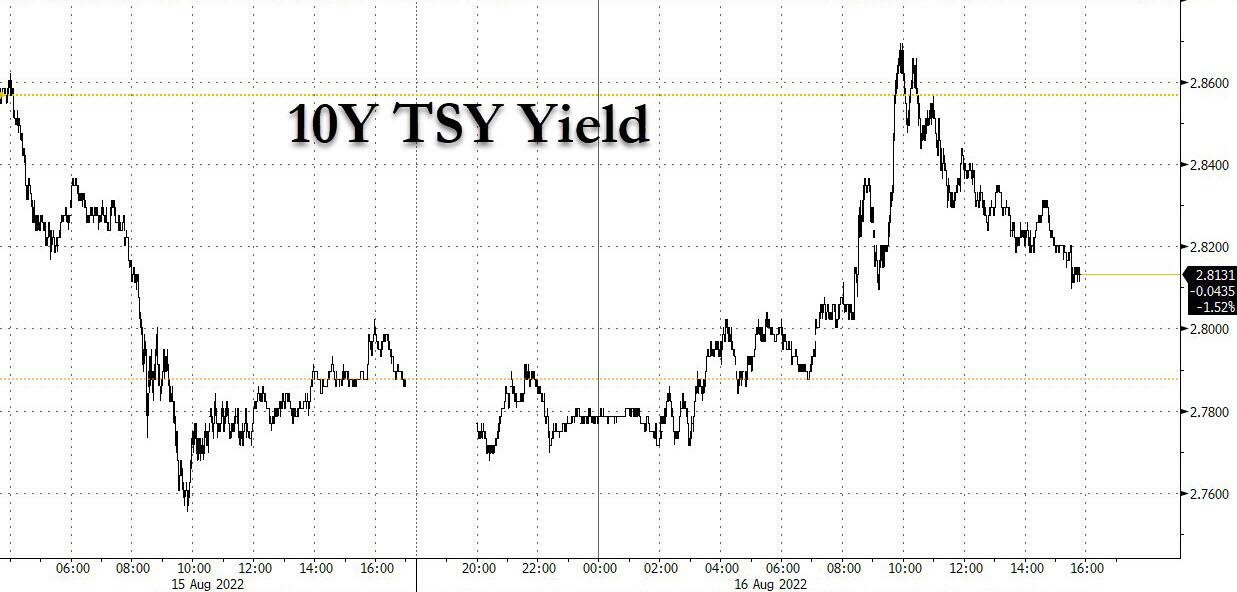
Despite the precious metals’ wild swings, YTD, on a buy and hold basis it has done much better than the S&P 500. As of today, gold is down -3.07% vs. the S&P’s -9.71%.
It’s interesting to note, when looking at the big picture, that gold holdings have increased, while Treasury holdings (bonds) have trended lower, as this chart demonstrates.
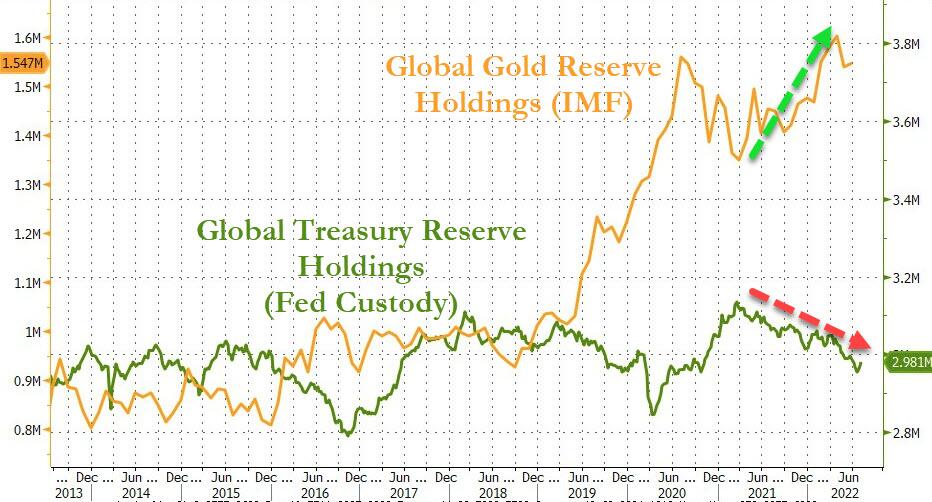
Hmm…
2. ETFs in the Spotlight
In case you missed the announcement and description of this section, you can read it here again.
It features some of the 10 broadly diversified domestic and sector ETFs from my HighVolume list as posted every Saturday. Furthermore, they are screened for the lowest MaxDD% number meaning they have been showing better resistance to temporary sell offs than all others over the past year.
The below table simply demonstrates the magnitude with which these ETFs are fluctuating above or below their respective individual trend lines (%+/-M/A). A break below, represented by a negative number, shows weakness, while a break above, represented by a positive percentage, shows strength.
For hundreds of ETF choices, be sure to reference Thursday’s StatSheet.
For this closed-out domestic “Buy” cycle (2/24/2022), here’s how some of our candidates have fared. Keep in mind that our Domestic Trend Tracking Index (TTI) signaled a “Sell” on that date, which overrode the existing “Buys” shown for SPY and IYM:
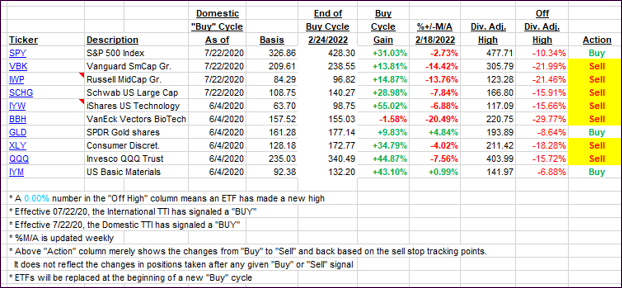
Click image to enlarge.
Again, the %+/-M/A column above shows the position of the various ETFs in relation to their respective long-term trend lines, while the trailing sell stops are being tracked in the “Off High” column. The “Action” column will signal a “Sell” once the -12% point has been taken out in the “Off High” column, which has replaced the prior -8% to -10% limits.
3. Trend Tracking Indexes (TTIs)
Our TTIs edged a tad higher, with the Domestic one now having been on the bullish side for the third straight day. If this continues, we should have the official “Buy” signal by early next week.
This is how we closed 08/16/2022:
Domestic TTI: +1.72% above its M/A (prior close +1.42%)—Sell signal effective 02/24/2022.
International TTI: -4.11% below its M/A (prior close -4.55%)—Sell signal effective 03/08/2022.
Disclosure: I am obliged to inform you that I, as well as my advisory clients, own some of the ETFs listed in the above table. Furthermore, they do not represent a specific investment recommendation for you, they merely show which ETFs from the universe I track are falling within the specified guidelines.
All linked charts above are courtesy of Bloomberg via ZeroHedge.
Contact Ulli