
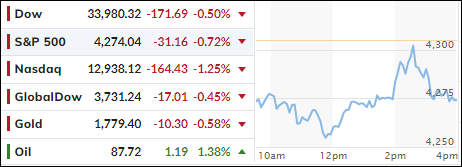
[Chart courtesy of MarketWatch.com]
- Moving the markets
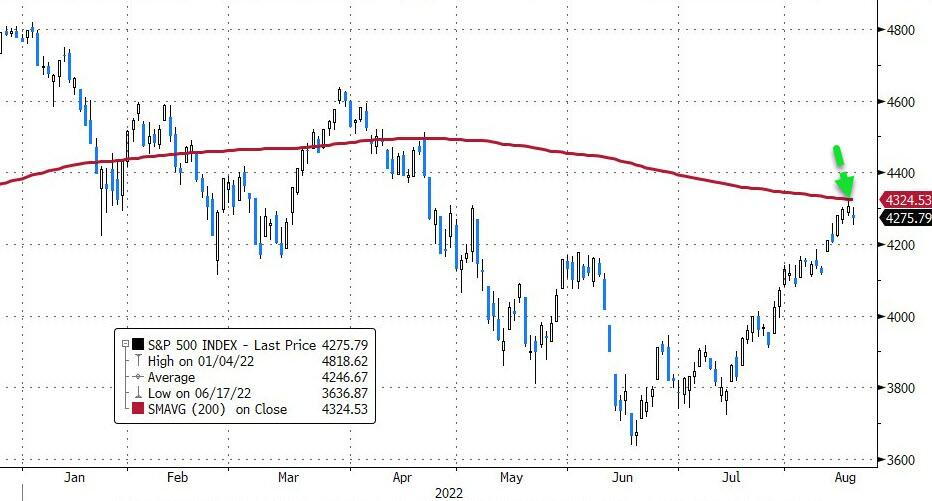
A few items kept traders in a defensive position with overhead resistance lurking due to the S&P 500 approaching its 200-day M/A, a level that is often associated with a major trend change. Historically, these attempts have not played out well for the bulls, as this chart shows.
The other issues for traders’ non-committal behavior were the latest retail sales data, which stalled in July, as Target slipped due to excess inventory, while Lowe’s traded higher despite a questionable quarter.
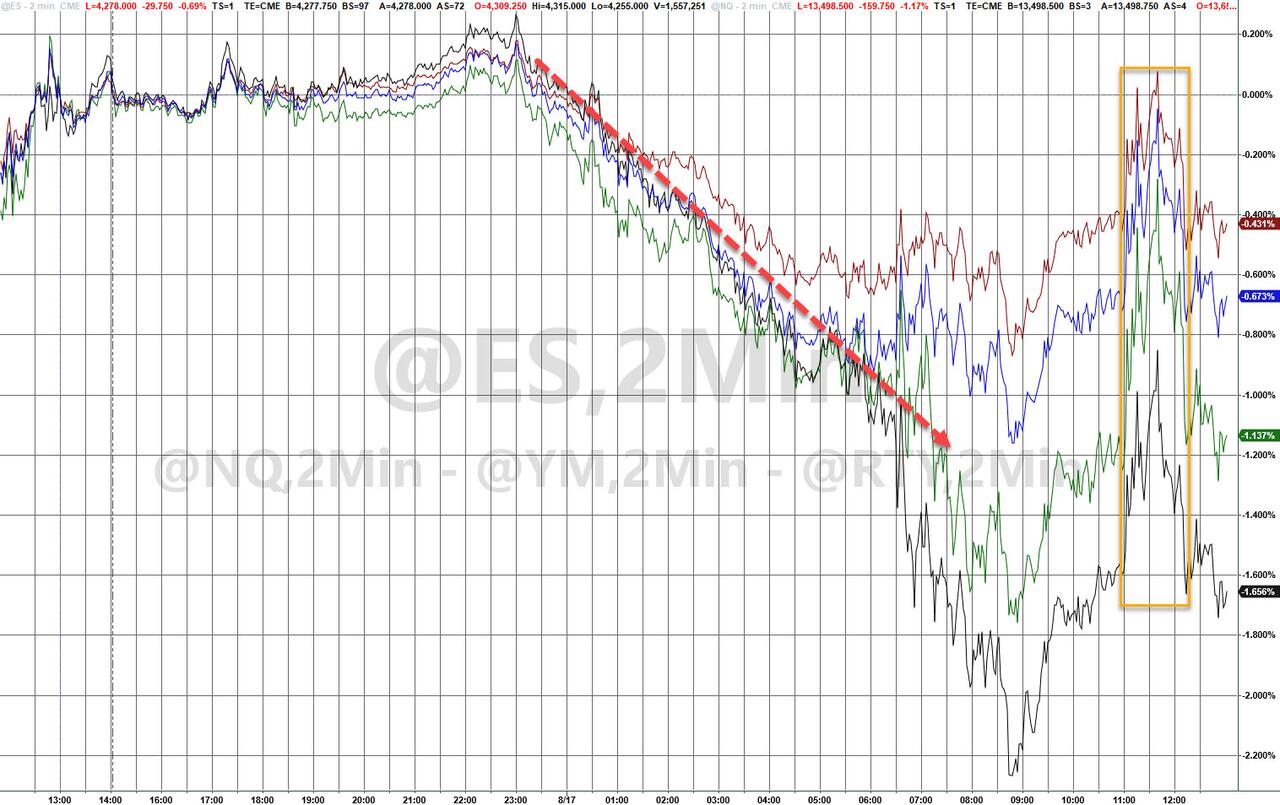
That was followed by investors’ assessment of the Fed’s latest FOMC minutes, which again confirmed what many of the Fed’s mouth pieces have opined on, namely that their policy remains aggressive regarding hiking rates until it can subdue inflation.
But, to make the issue more confusing, the Central Bank also indicated that it could soon slow the speed of its tightening, while also acknowledging the dire strait of the economy and risk to the downside for GDP growth, as quoted by MarketWatch.
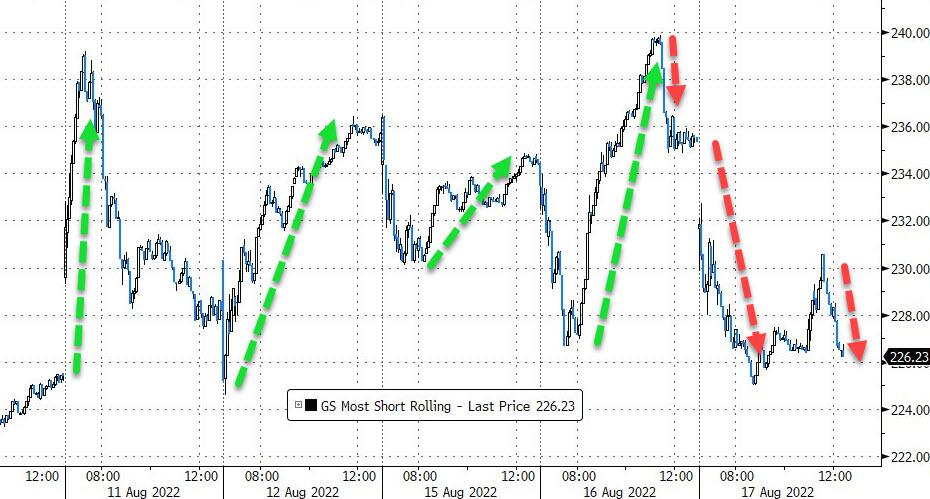
There you have it. The Fed has no clue what’s next and has conveniently covered both possibilities. This left the market in a state of confusion and allowed the bears to score a win for the first day in six, as the usual short squeeze simply ran out of ammo.
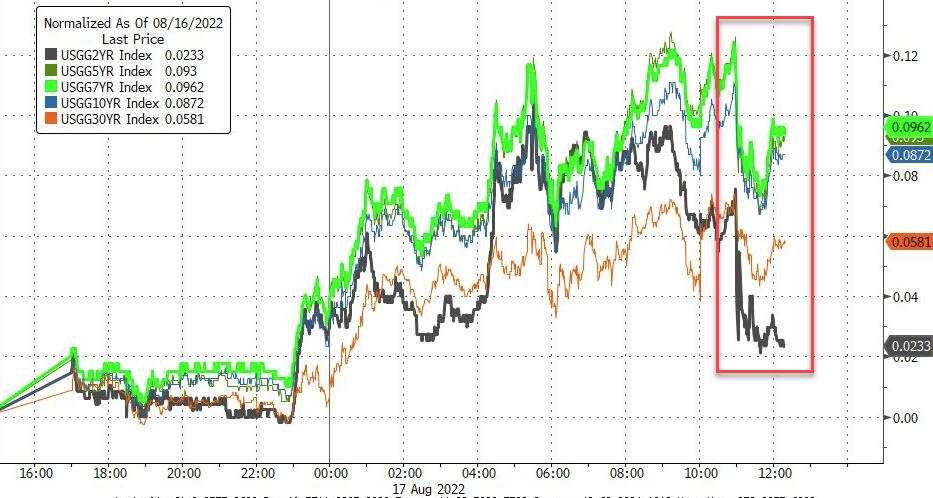
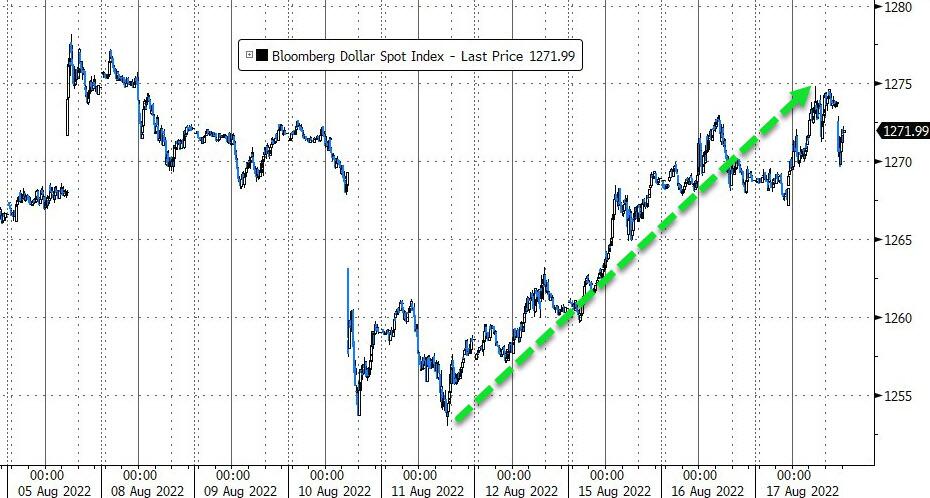
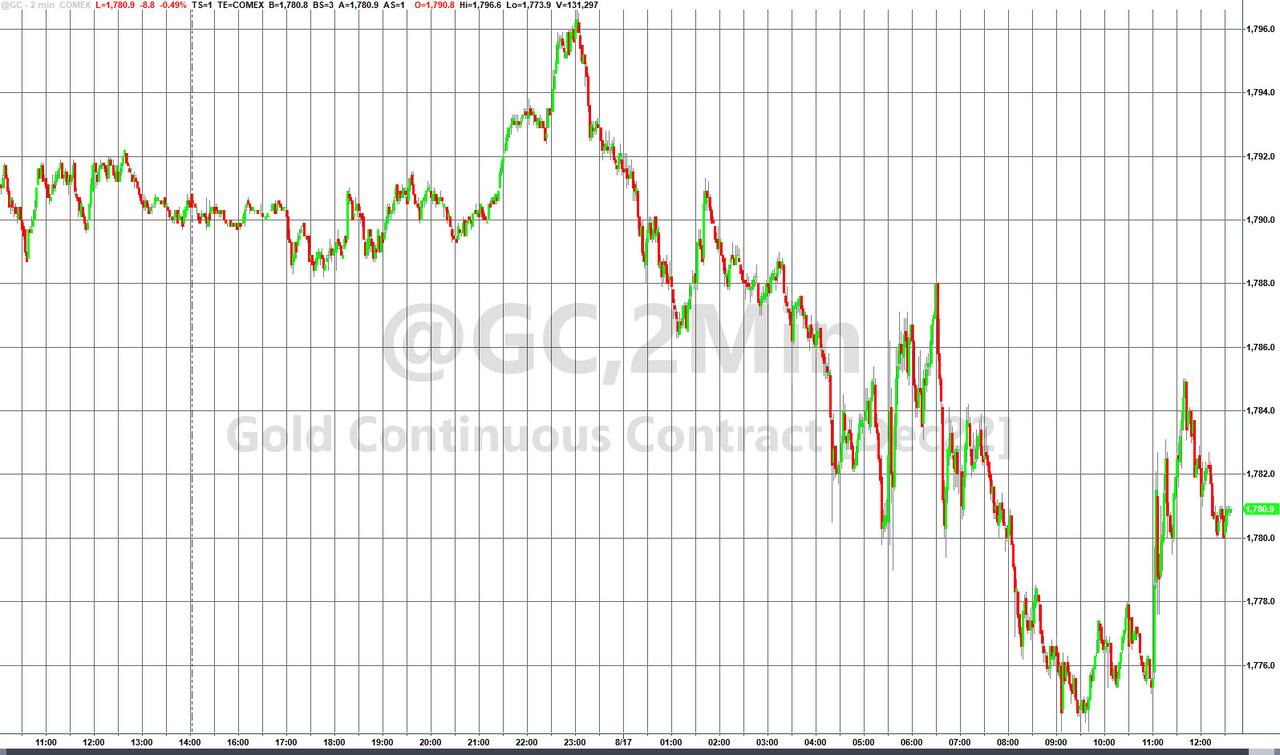
Bond yields rose with the 10-year now it hot pursuit of its 3% level, but its 100-day M/A acted as a strong resistance level. The US Dollar built on recent gains and closed higher, while gold lost its $1,800 level again.
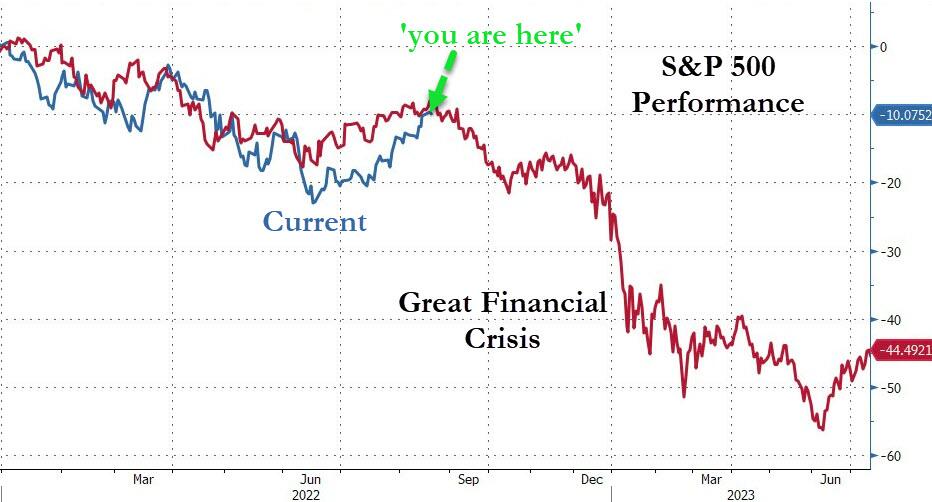
Brace for impact is how ZeroHedge closed its commentary with a new comparison of where the S&P 500 sits now compared to the Great Financial Crises in 2008.
Will history repeat itself?
2. ETFs in the Spotlight
In case you missed the announcement and description of this section, you can read it here again.
It features some of the 10 broadly diversified domestic and sector ETFs from my HighVolume list as posted every Saturday. Furthermore, they are screened for the lowest MaxDD% number meaning they have been showing better resistance to temporary sell offs than all others over the past year.
The below table simply demonstrates the magnitude with which these ETFs are fluctuating above or below their respective individual trend lines (%+/-M/A). A break below, represented by a negative number, shows weakness, while a break above, represented by a positive percentage, shows strength.
For hundreds of ETF choices, be sure to reference Thursday’s StatSheet.
For this closed-out domestic “Buy” cycle (2/24/2022), here’s how some of our candidates have fared. Keep in mind that our Domestic Trend Tracking Index (TTI) signaled a “Sell” on that date, which overrode the existing “Buys” shown for SPY and IYM:
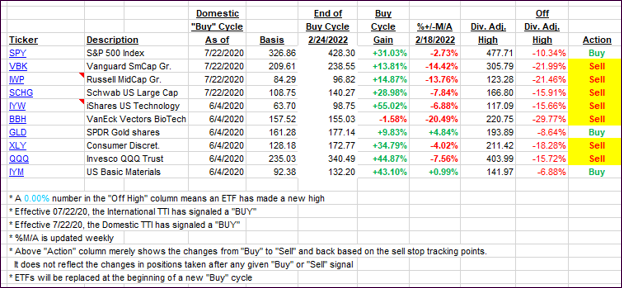
Click image to enlarge.
Again, the %+/-M/A column above shows the position of the various ETFs in relation to their respective long-term trend lines, while the trailing sell stops are being tracked in the “Off High” column. The “Action” column will signal a “Sell” once the -12% point has been taken out in the “Off High” column, which has replaced the prior -8% to -10% limits.
3. Trend Tracking Indexes (TTIs)
Our TTIs dumped as upward momentum was absent into the close. Our Domestic TTI reversed and is now within striking distance of slipping back into bear market territory.
This is how we closed 08/17/2022:
Domestic TTI: +0.76% above its M/A (prior close +1.72%)—Sell signal effective 02/24/2022.
International TTI: -4.56% below its M/A (prior close -4.11%)—Sell signal effective 03/08/2022.
Disclosure: I am obliged to inform you that I, as well as my advisory clients, own some of the ETFs listed in the above table. Furthermore, they do not represent a specific investment recommendation for you, they merely show which ETFs from the universe I track are falling within the specified guidelines.
All linked charts above are courtesy of Bloomberg via ZeroHedge.
Contact Ulli