Directionless Wandering

Ulli Uncategorized Contact

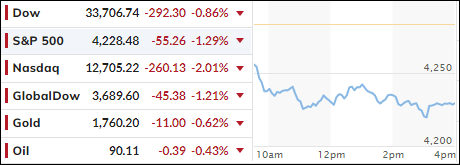
[Chart courtesy of MarketWatch.com]

  1. Moving the markets

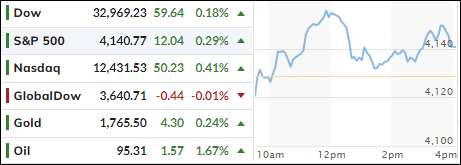
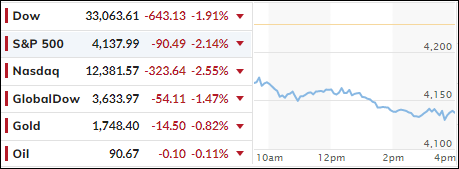
Aimless meandering, with a slight upside bias, continued but, in the end, traders were too much on edge ahead of Powell’s speech on Friday regarding inflation and interest rates following the Jackson Hole symposium.

Beliefs are that the Fed will reinforce its view of fighting inflation, which could create a headwind for equity prices. Nevertheless, today, the major indexes managed to snap a 3-day slide.  

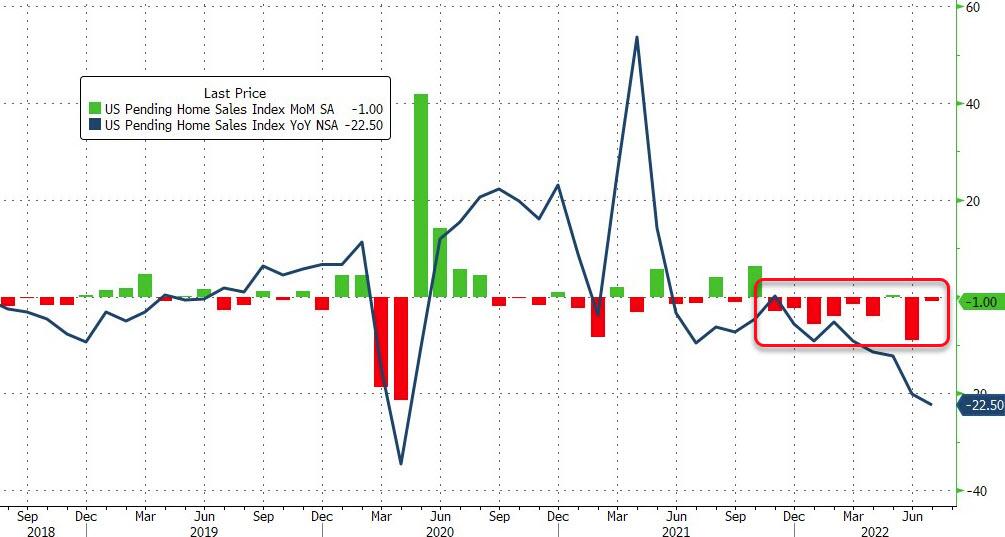
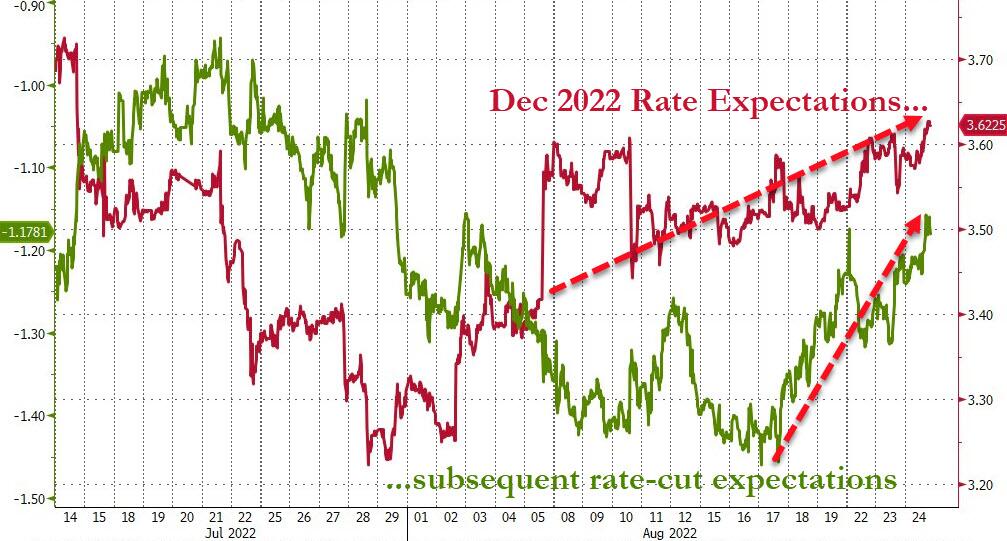
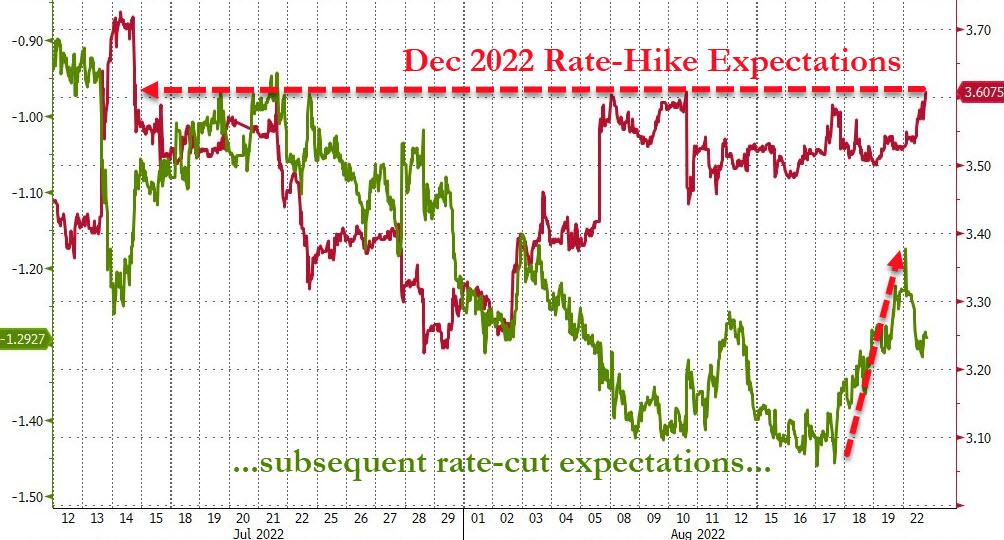
Despite horrible economic data for Pending Home Sales and Durable Goods Orders, rate hike expectations rose with subsequent rate cut expectations also moving further into hawkish territory.

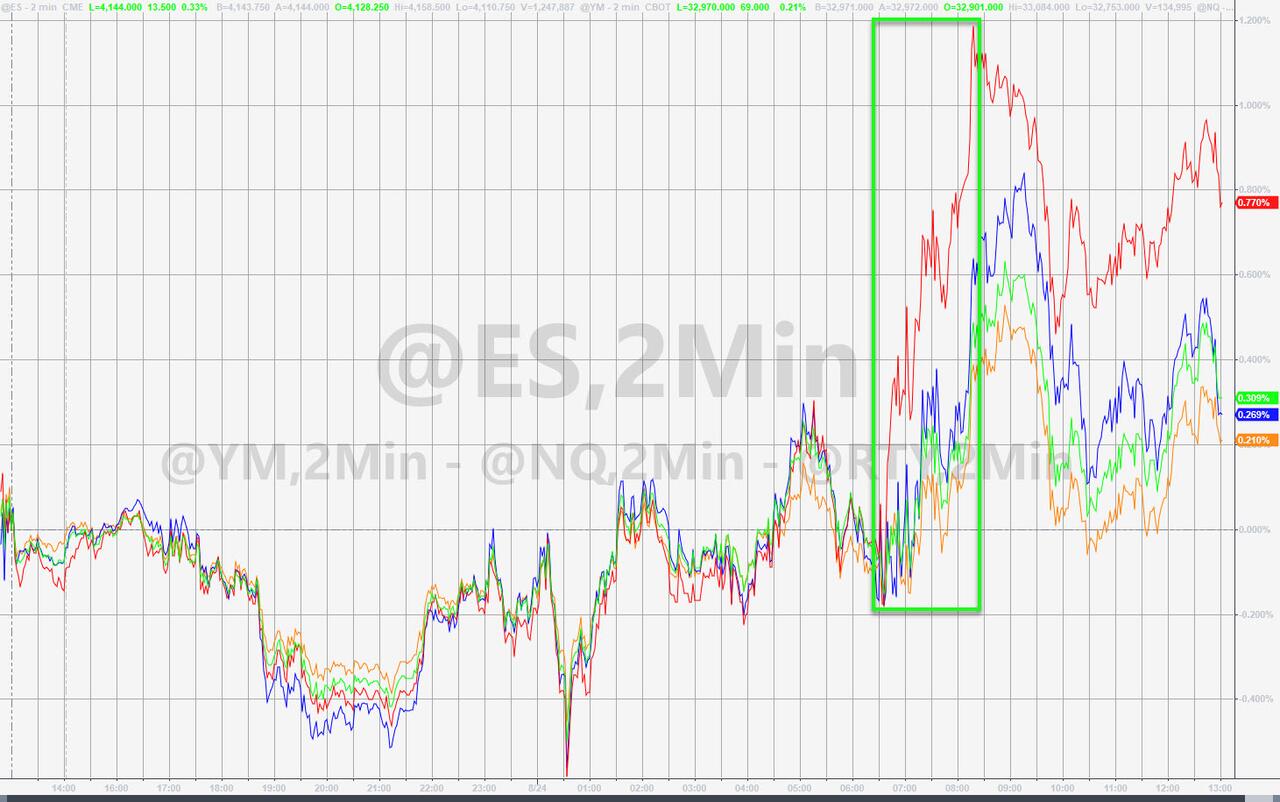
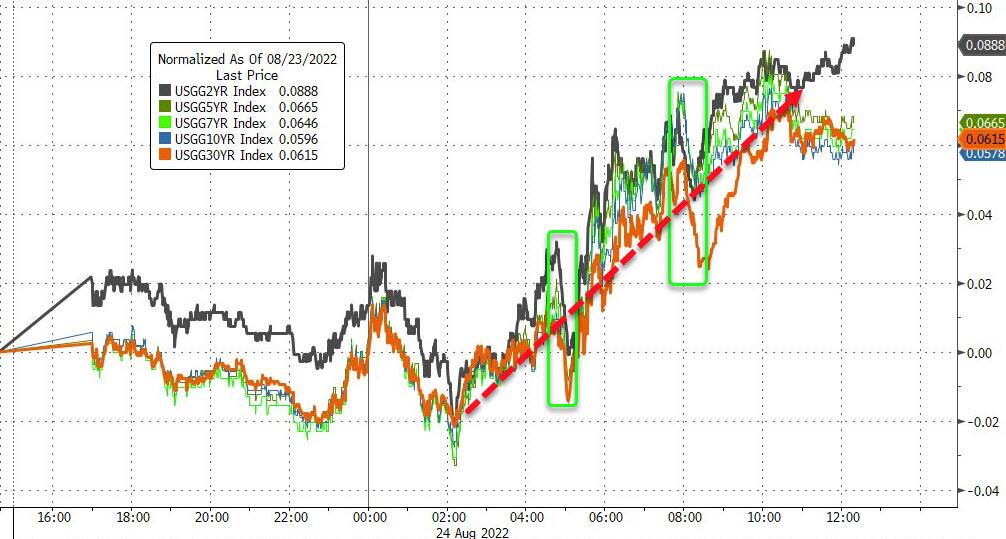
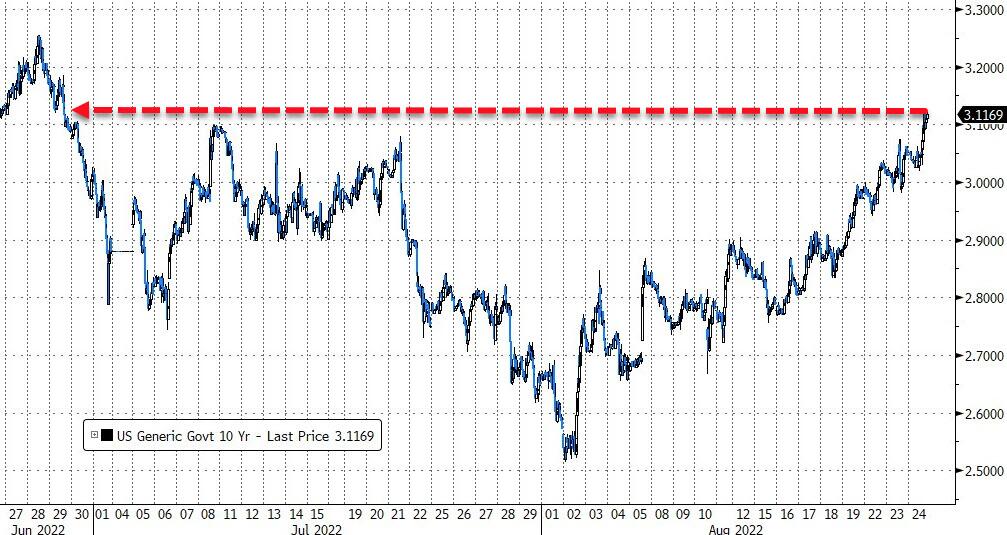
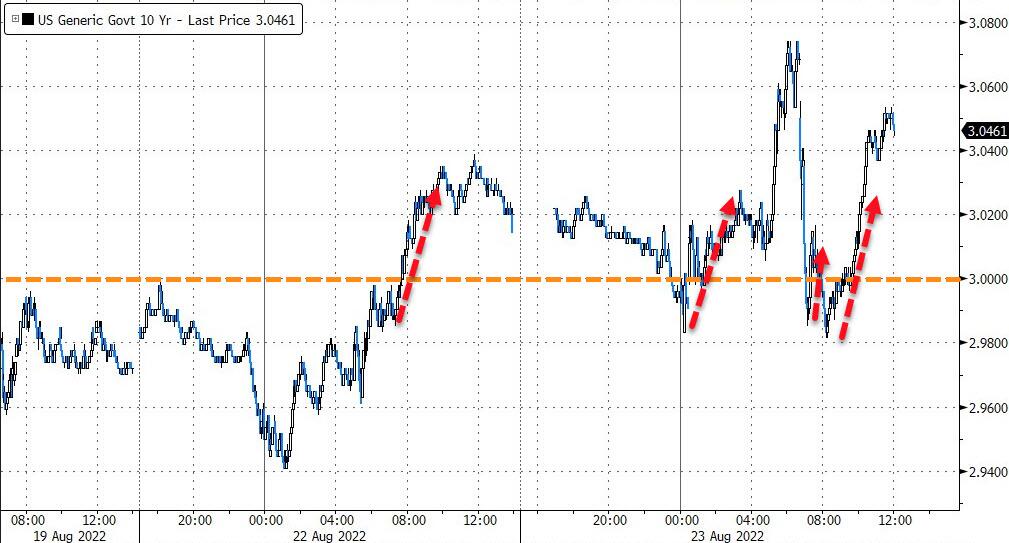
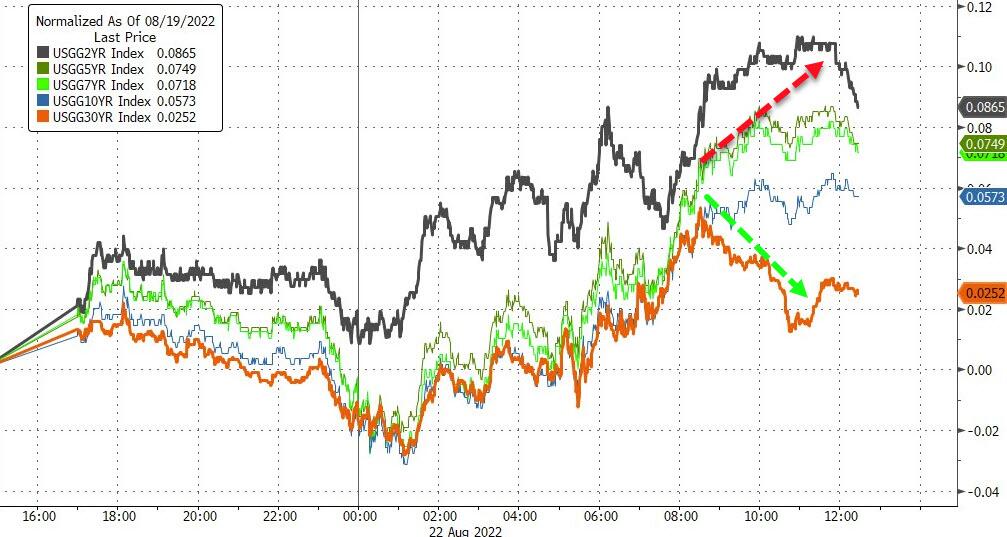
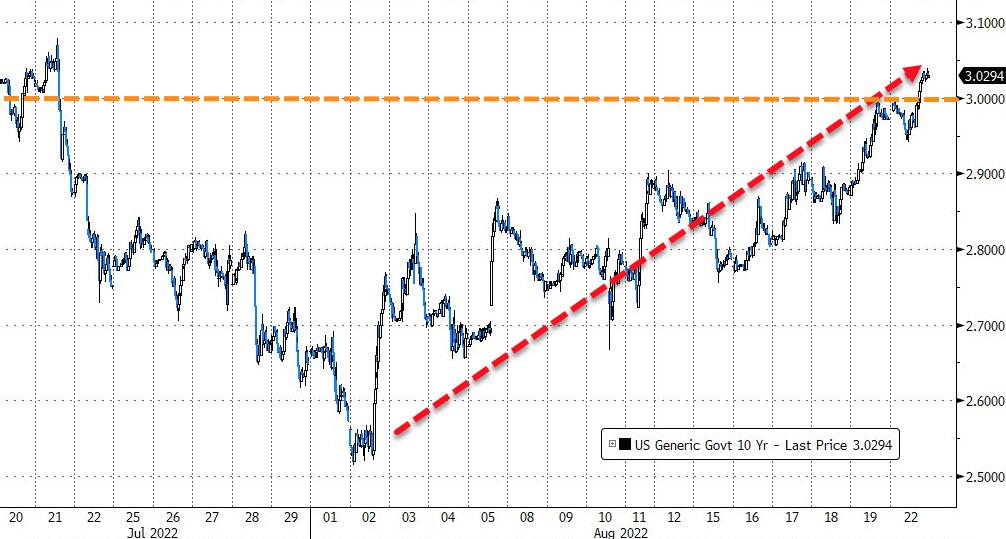
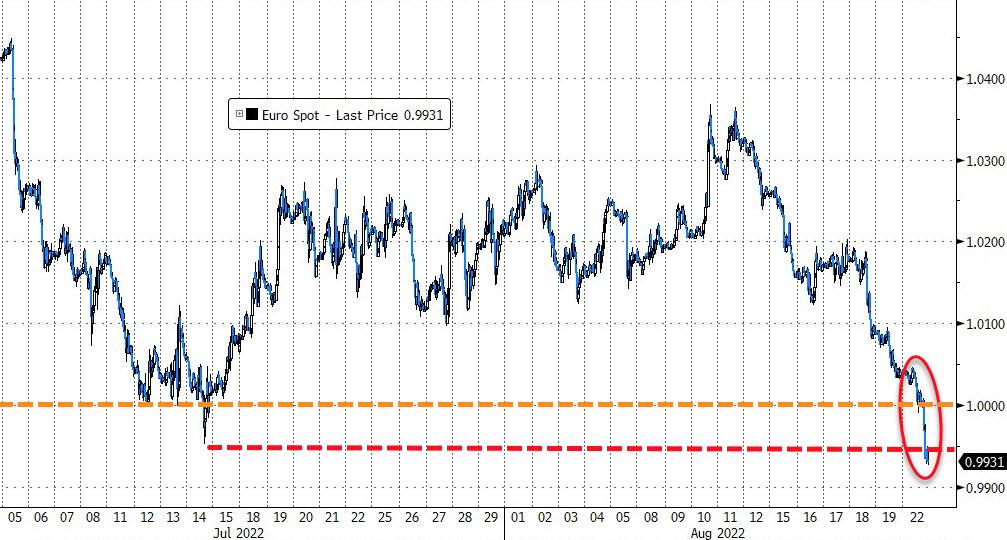
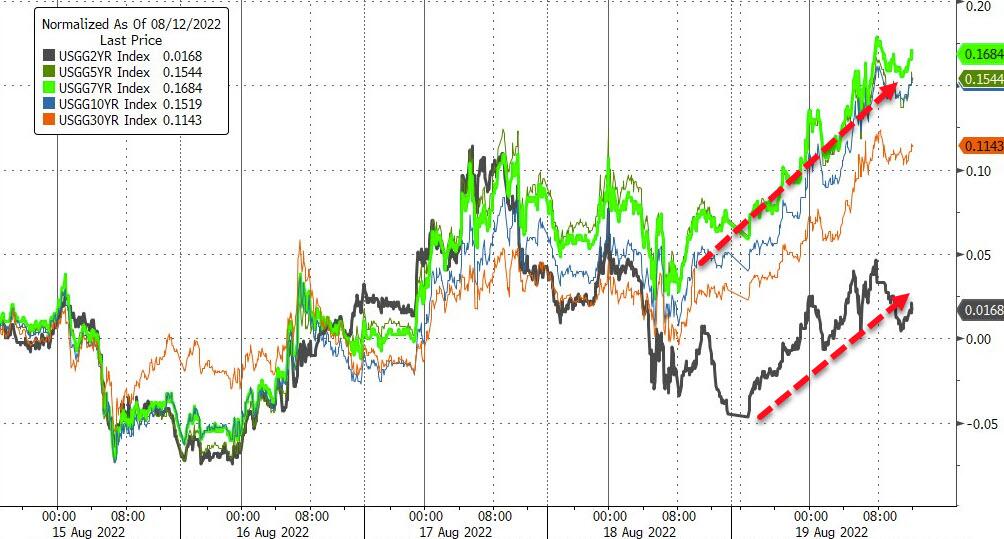
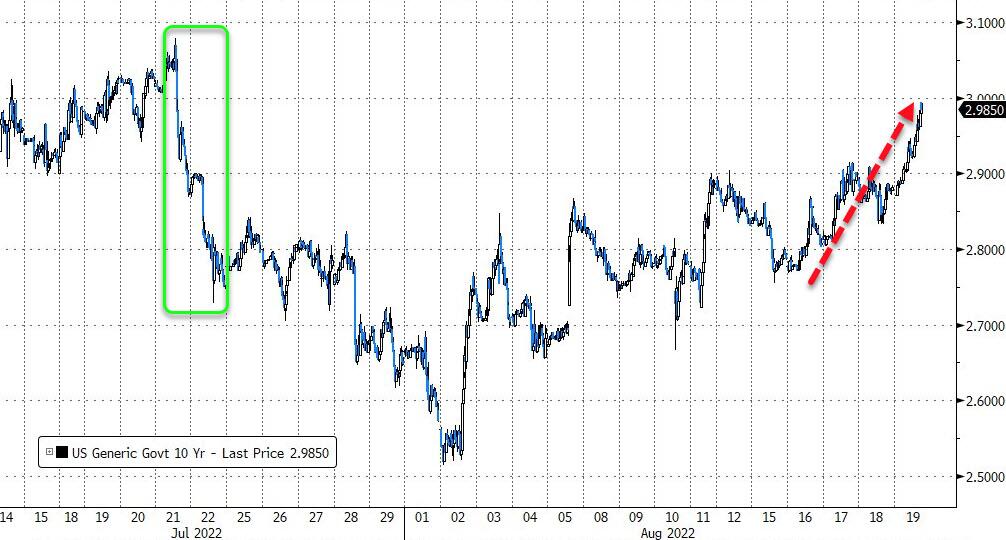
Bond yields did not help the markets at all, as they rose for the fourth day in a row, with the 10-year now solidly positioned above its 3% level and touching a 2-month high, as Zero Hedge pointed out.

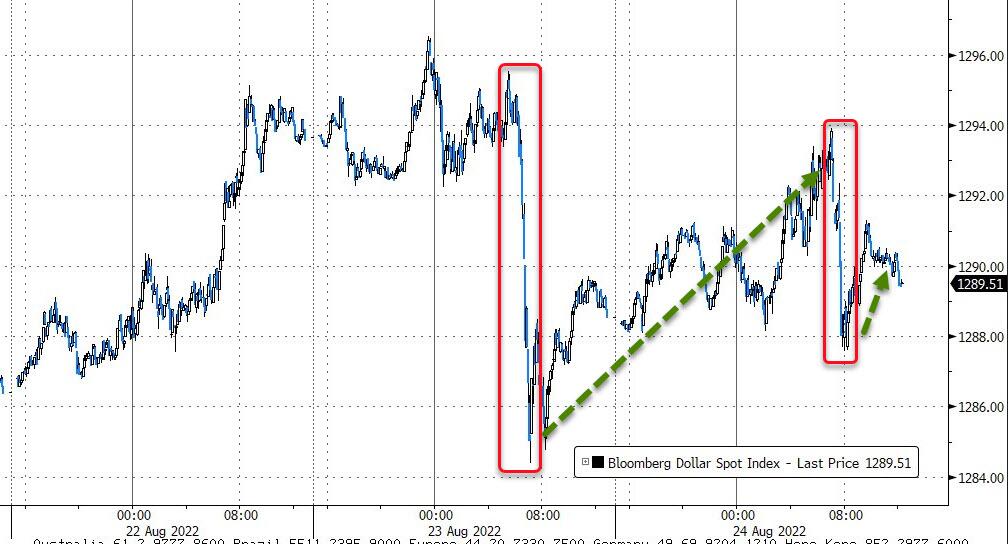
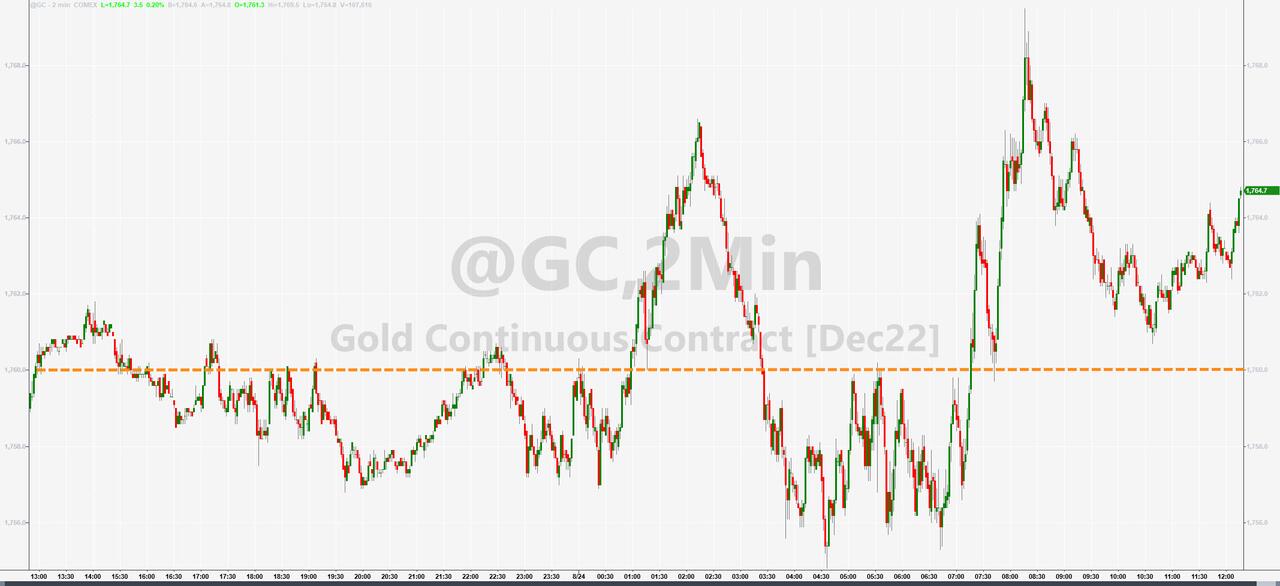
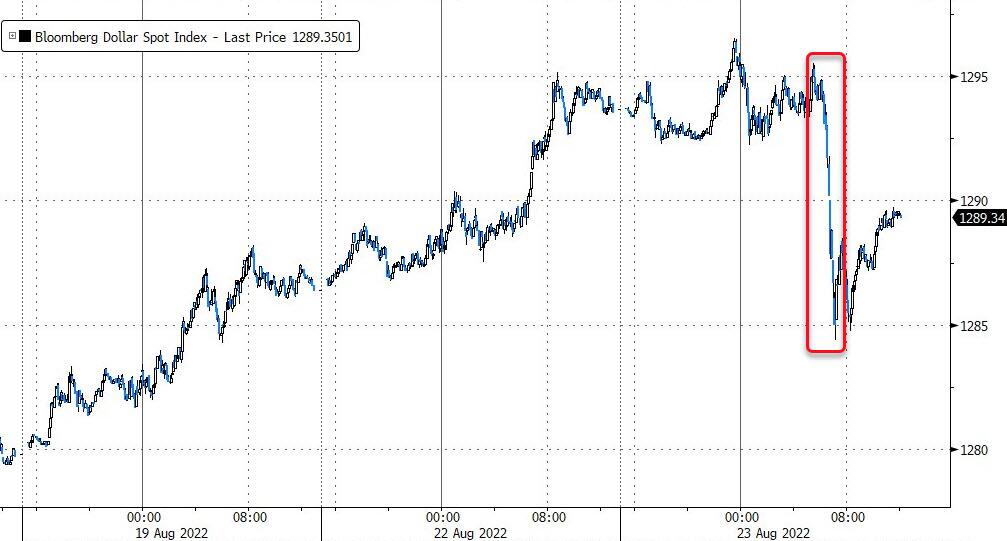
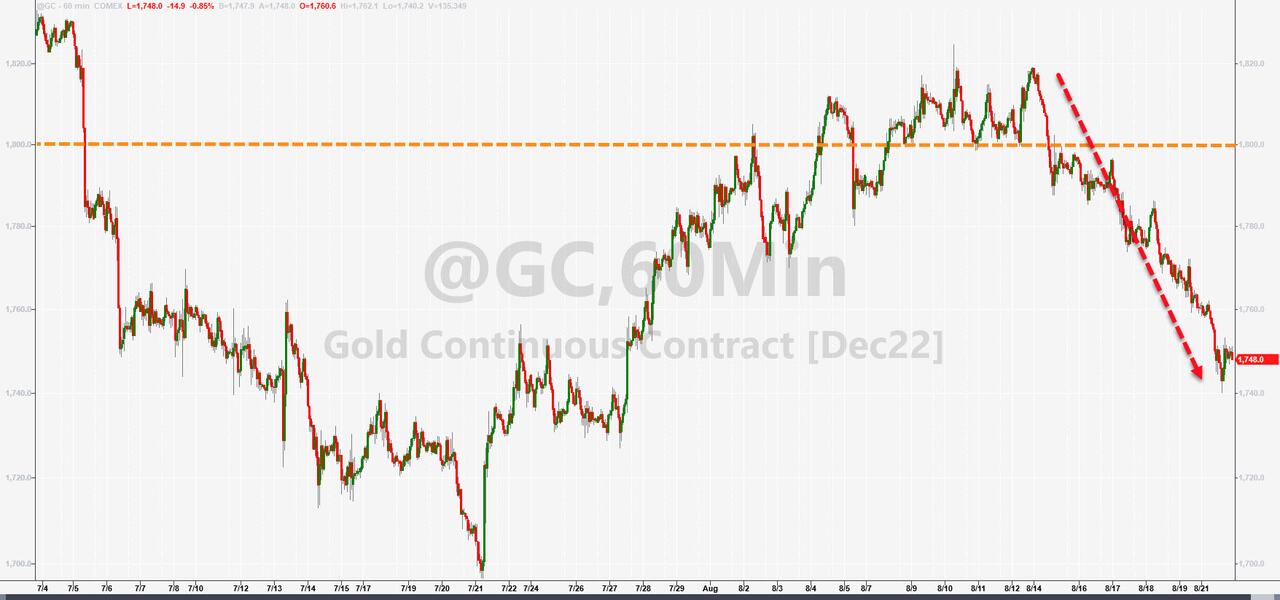
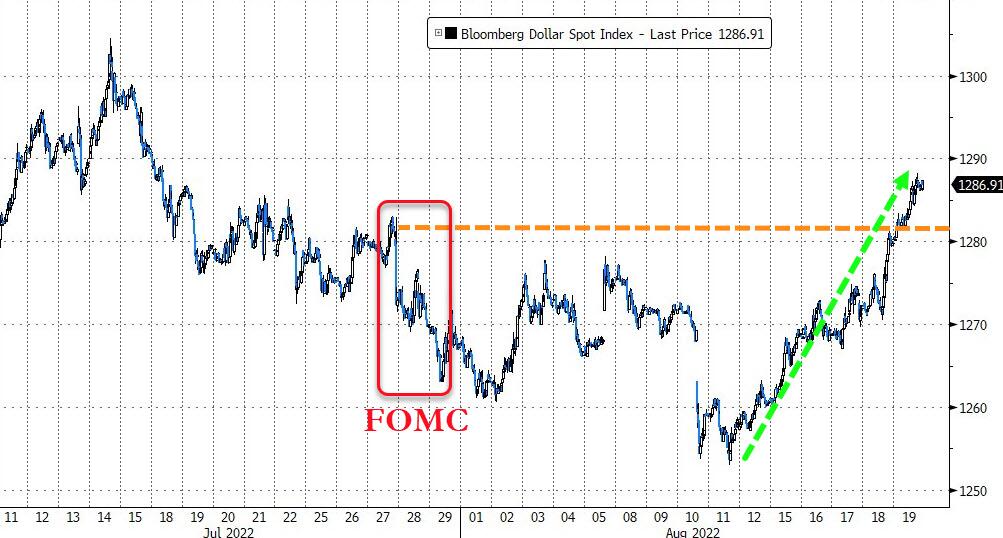
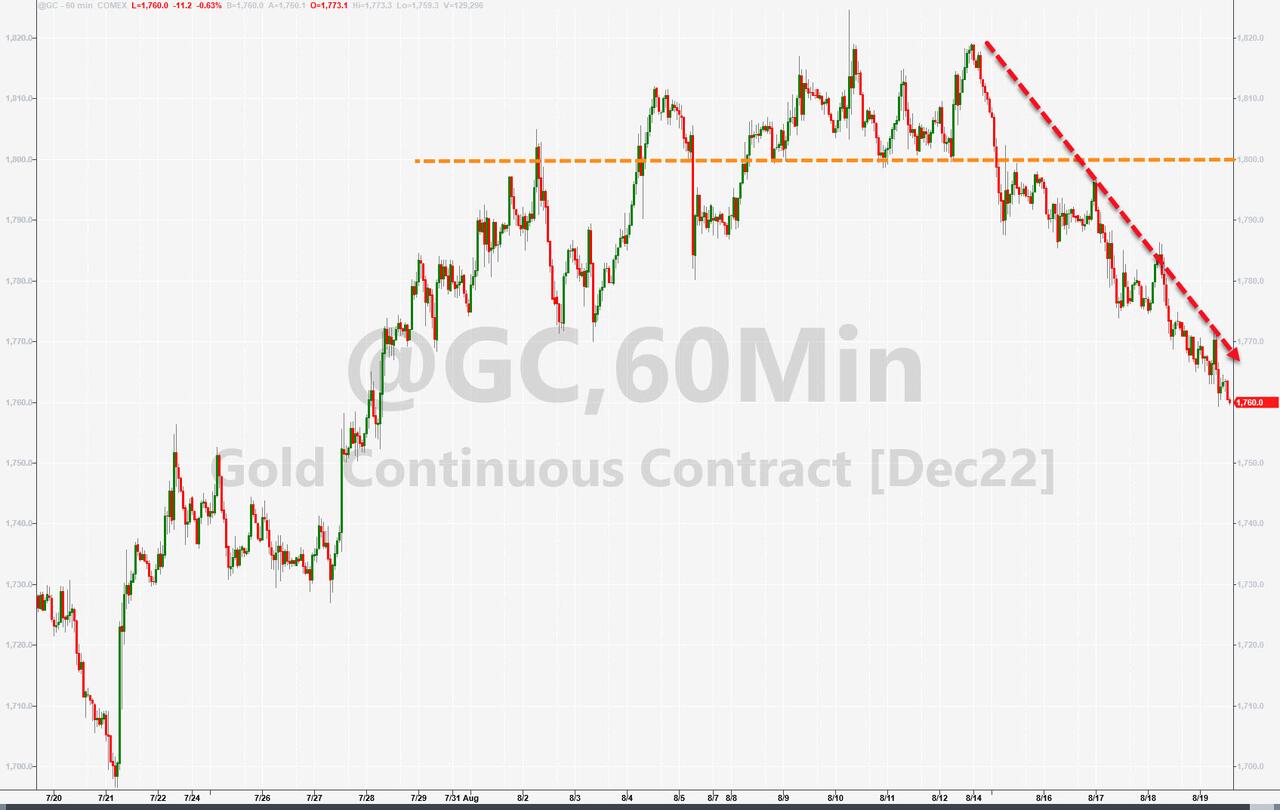
Despite the US Dollar rebounding from yesterday’s weak showing, gold held firm and closed higher for the session.

I expect another slow trading day tomorrow, but we could see a breakout or breakdown after Powell’s speech on Friday.

Read More
Treading Water

Ulli Market Commentary Contact

[Chart courtesy of MarketWatch.com]

  1. Moving the markets

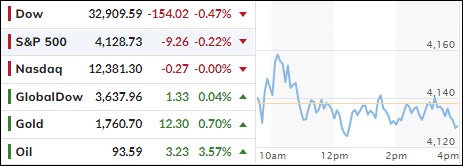
An early rebound attempt had no legs causing the major indexes to slip below their respective unchanged lines. Not much was lost though, as the tug-of-war between the hawkish crowd (higher rates) and the dovish supporters (lower rates) were evenly matched.

Ahead of Friday’s Jackson Hole symposium, and Powell’s speech thereafter, the markets looked to be subdued with speculation rampant as to which way he will be leaning regarding future rate hikes.

Traders are bracing themselves for a hawkish message, which could very well pull the rug out from under equities with voices growing louder that the rebound off the June lows was nothing but a bear market rally, and that those lows will be revisited at some point soon.

That goes along with the status of my Domestic Trend Tracking Index (TTI), which spent only 5 days in bullish territory before slipping back below its trend line to -2.45%. Consequently, we will be liquidating our small equity position again—very likely tomorrow.  

Poor economic data, with crashing new home sales at the center, dominated headline news with battle cries getting noisier that “the Fed must save us,” which, of course, expresses hope of not necessarily lower rates but less of a hike in September.

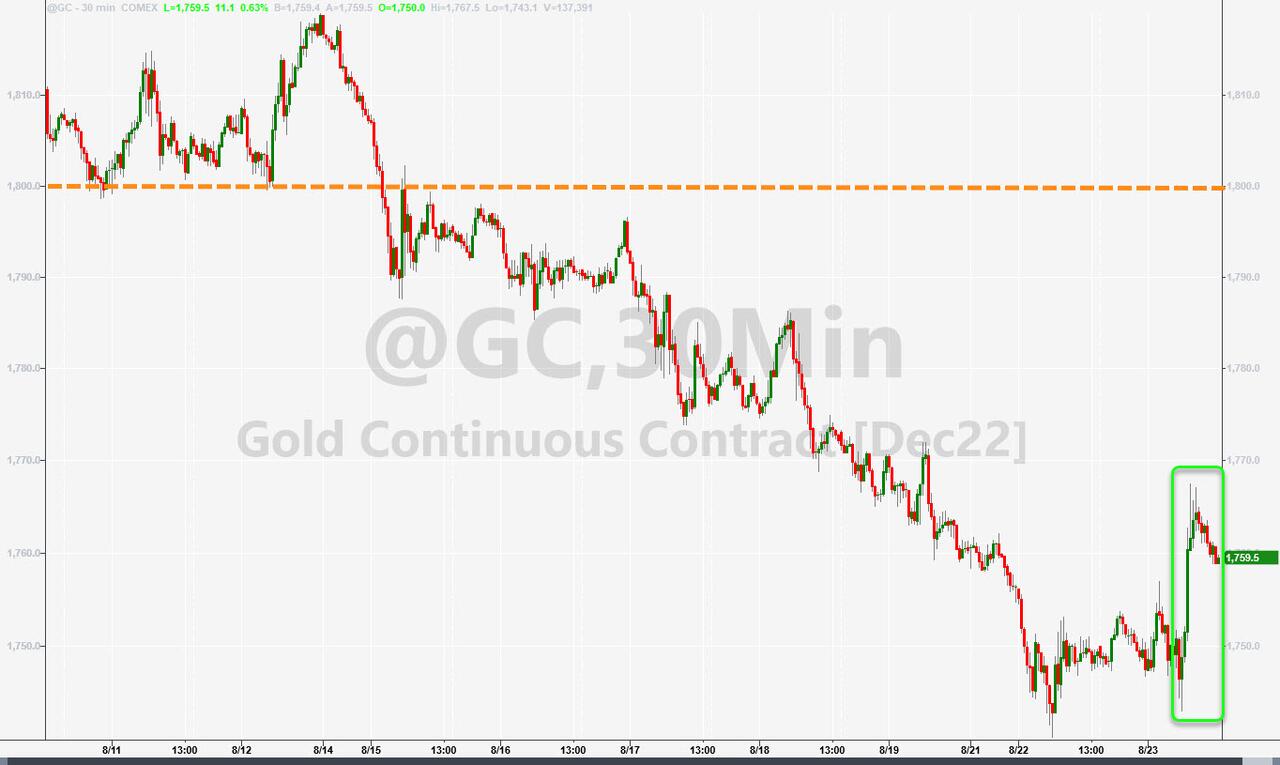
Bond yields chopped around all day, but the 10-year found support at the much fought-over 3% level and closed above it. With the US Dollar heading south for a change, gold benefitted with the precious metal reclaiming its $1,750 level.

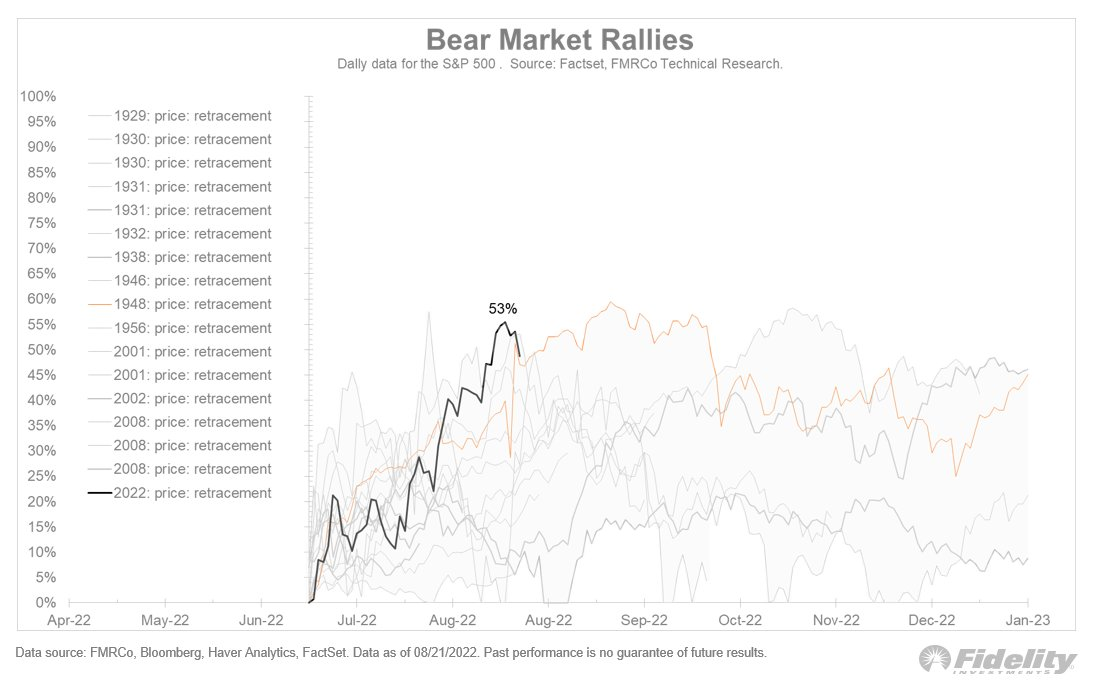
Analyst Jurrian Timmer had this interesting take:

The rebound rally is at a crossroads:

“The S&P 500 has retraced 53% of its decline, and this is as far as bear market rallies go…”

Hmm, as that graph shows, anything above that level would then have to be considered a new bull market.

Read More

Skepticism About The ‘Fed Pivot’ Thrashes Equities

Ulli Market Commentary Contact

[Chart courtesy of MarketWatch.com]

  1. Moving the markets

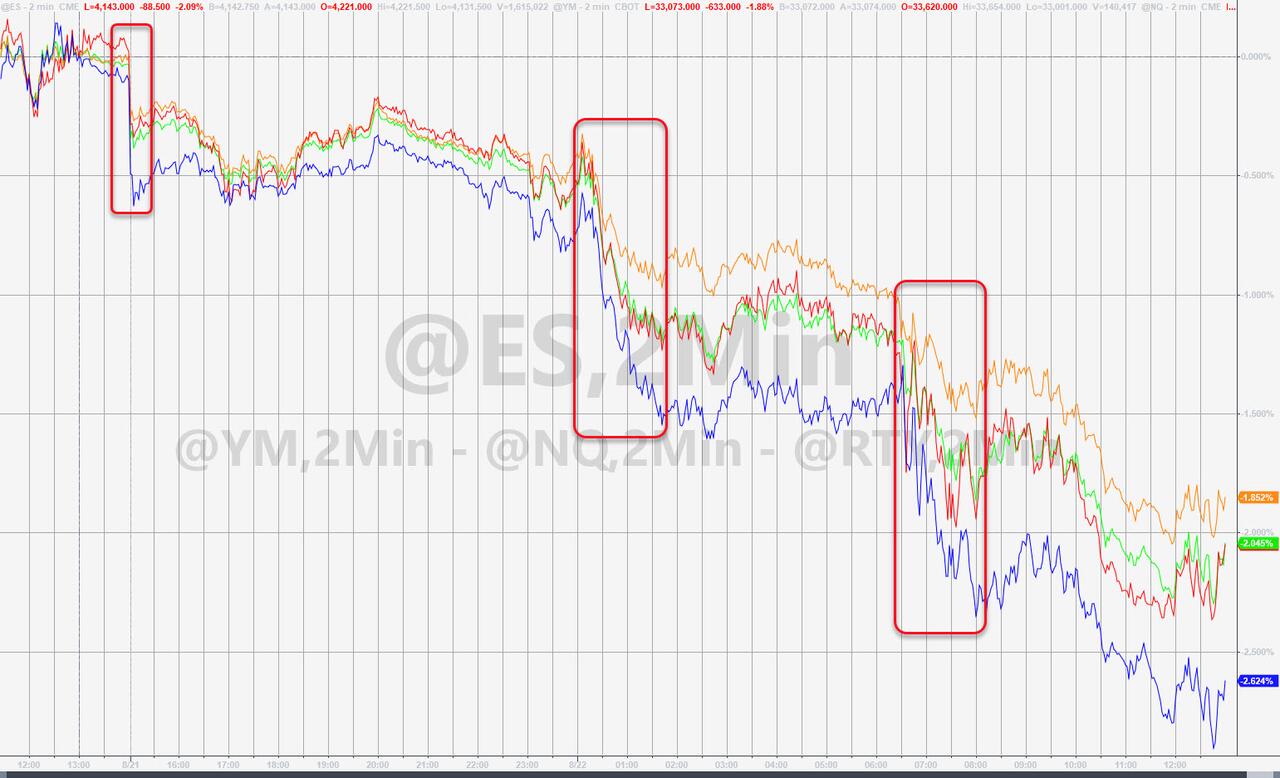
Much of the July/August rebound from deep bear market territory was based on hope that the Fed will have to abandon its hawkish interest rate policy and “pivot” towards dovishness, which would result in lower rates and hence a continuation of the bullish theme.

While this pivot may eventually happen, it may not occur as quickly as anticipated. The Fed and its mouthpieces have in the recent past pounced on the reality that their inflation fight will continue, a fact that traders conveniently ignored.

Analyst Peter Schiff explained that the end to interest hikes has been pushed back, which is a negative for growth stocks for two reasons:

  1. It means higher interest rates. That is a big negative for growth stocks because it discounts their future earnings by a higher interest rate.
  2. If the Fed is going to have to stay higher for longer, that means the economy will be weaker for longer. That will weigh down earnings.

He thinks the sucker rally had ended and the primary trend (down) has resumed. I agree with his assessment as, technically speaking, our Domestic Trend Tracking Index (TTI) has plunged back into bear market territory (section 3.)

As a result, rate hike expectations are back at their highest since mid-July, as ZeroHedge pointed out, and subsequent rate-cut expectations have tightened as well.

The major indexes took a dive, led by the Nasdaq, with all of them heading towards their 100-day M/As, after the 200-day M/As proved to be too much overhead resistance.    

Bond yields climbed with the 10-year again conquering its 3% level and closing above it. The Euro crashed to its weakest against the US Dollar, which rallied to its highest close since June 2002, as ZeroHedge reported. Gold extended its losses below $1,800 due to the dollar’s strength.

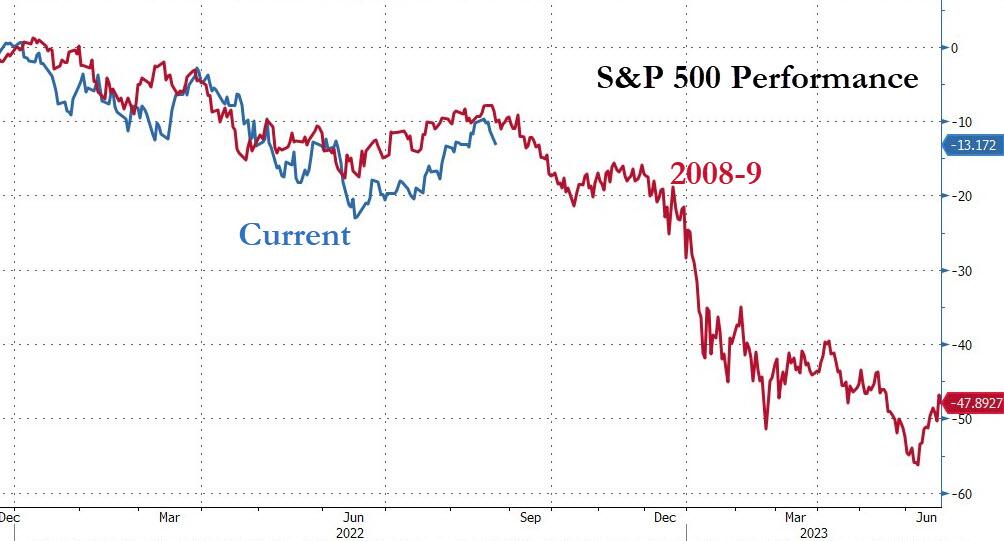
The analog to 2008 appears to be on target—at least for right now.

Read More

ETFs On The Cutline – Updated Through 08/19/2022

Ulli ETFs on the Cutline Contact

Below, please find the latest High-Volume ETF Cutline report, which shows how far above or below their respective long-term trend lines (39-week SMA) my currently tracked ETFs are positioned.

This report covers the HV ETF Master List from Thursday’s StatSheet and includes 312 High Volume ETFs, defined as those with an average daily volume of more than $5 million, of which currently 70 (last week 99) are hovering in bullish territory. The yellow line separates those ETFs that are positioned above their trend line (%M/A) from those that have dropped below it.

Take a look:                                                                   

The HV ETF Master Cutline Report

In case you are not familiar with some of the terminology used in the reports, please read the Glossary of Terms. If you missed the original post about the Cutline approach, you can read it here.      

ETF Tracker Newsletter For August 19, 2022

Ulli ETF Tracker Contact

ETF Tracker StatSheet          

You can view the latest version here.

OPTIONS EXPIRATIONS DAY WHACKS MARKETS

[Chart courtesy of MarketWatch.com]

  1. Moving the markets

Bulls were nowhere to be found today, as the $2.1 Trillion options expiration day exacted a pound of flesh from the markets, thereby breaking the S&P 500’s 4-week win streak. The summer rally hit the skids and brought thoughts of this being the end of the bear market bounce back into play.

A variety of forces, besides options expirations, contributed to the sour mood on Wall Street. The Fed minutes from the July meeting, as well as Federal Reserve President Bullard’s comments that the Central Bank would likely continue hiking rates in the near term, which again dashed hopes for the infamous “dovish pivot.”

Then Richmond President Barkin pulled that rug out even further with this comment:

“The Fed must curb inflation even if this causes a recession.”

Ouch!

Goldman Sachs laid out this list of items, which added to the sell-off:

  • Retail Meme Stocks Unraveling – BBBY -40%…Imagine shorts will be coming out of the woodwork
  • Crypto following suit
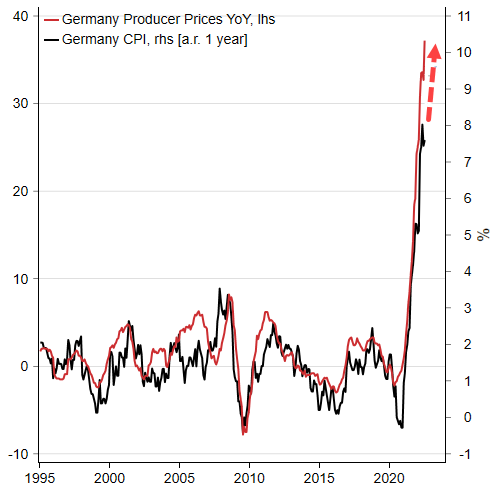
  • German PPI Came in at Record Highs – 5.7% MoM rise and 37.2% YoY
  • DXY Strong following suit – EURUSD testing parity…
  • Bullard called for 75bps in September – yet mkt still pricing in 50/50 short of a 75bps hike in Sept.
  • Yields Higher following suit – 10y at 2.97…
  • Large Expiry – $2T in options rolling off

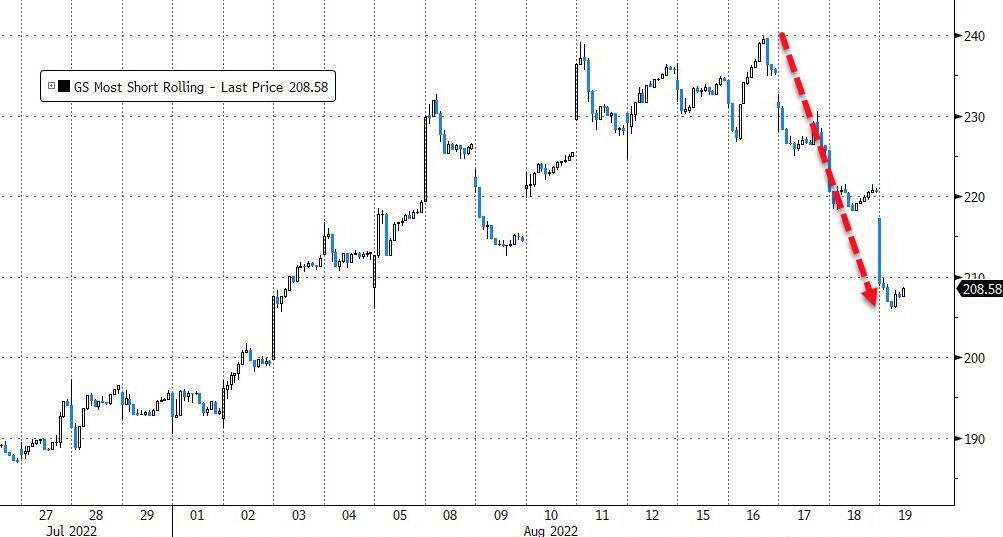
The most shorted stocks fell hard this week, as the squeeze simply evaporated, while bond yields rallied, with the 10-year almost reaching its 3% level. The US Dollar spiked and gained an amazing 2% for the week, as commodities, including gold, lagged.  

Headline news pointed to one market indicator with a perfect track record, which says that stocks have bottomed…Another says they are about to plunge again. ZeroHedge summed up the discrepancy like this:

In short, we have reached a perfect quantum state of a market based on flawless backward-looking indicators, where one “100% accurate” market signpost predicts stocks melt up from here (or at worst, suffer a modest drop), while another sees stocks tumbling as much as 2,500 if not lower to a new, and far more painful low.

One of the two will see their perfect predictive track record crushed forever.

Bloomberg’s updated historic comparison chart casts a picture that clearly shows what it is that we will potentially need to guard against via the use of our exit strategy.

Read More
Weekly StatSheet For The ETF Tracker Newsletter – Updated Through 08/18/2022

Ulli Uncategorized Contact

ETF Data updated through Thursday, August 18, 2022

Methodology/Use of this StatSheet:

1. From the universe of over 1,800 ETFs, I have selected only those with a trading volume of over $5 million per day (HV ETFs), so that liquidity and a small bid/ask spread are assured.

2. Trend Tracking Indexes (TTIs)

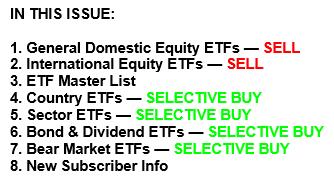
Buy or Sell decisions for Domestic and International ETFs (section 1 and 2), are made based on the respective TTI and its position either above or below its long-term M/A (Moving Average). A crossing of the trend line from below accompanied by some staying power above constitutes a “Buy” signal. Conversely, a clear break below the line constitutes a “Sell” signal. Additionally, I use an 12% trailing stop loss on all positions in these categories to control downside risk.

3. All other investment arenas do not have a TTI and should be traded based on the position of the individual ETF relative to its own respective trend line (%M/A). That’s why those signals are referred to as a “Selective Buy.” In other words, if an ETF crosses its own trendline to the upside, a “Buy” signal is generated. Here too, I recommend trailing sell stop of 12%, or less, depending on your risk tolerance.

If you are unfamiliar with some of the terminology, please see Glossary of Terms and new subscriber information in section 9.     

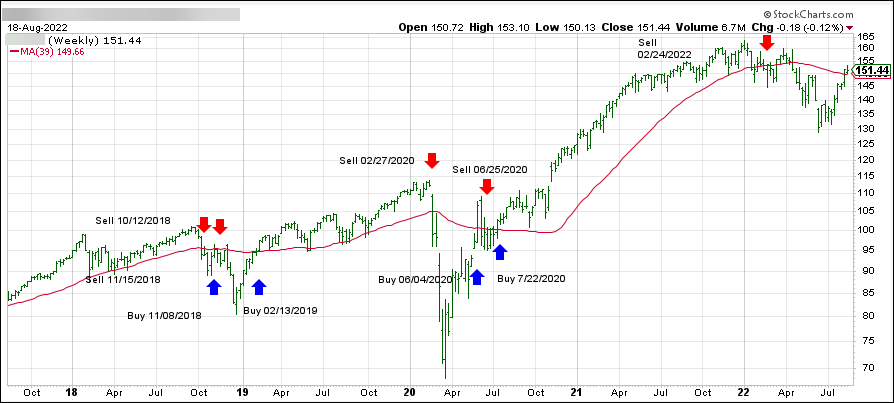
1. DOMESTIC EQUITY ETFs: SELL — since 02/24/2022

Click on chart to enlarge

Our main directional indicator, the Domestic Trend Tracking Index (TTI-green line in the above chart) has broken above its long-term trend line (red) by +1.08% but remains in “SELL” mode.

Read More