
[Chart courtesy of MarketWatch.com]
- Moving the market
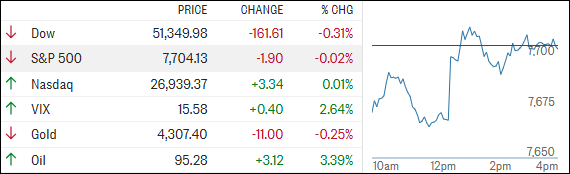
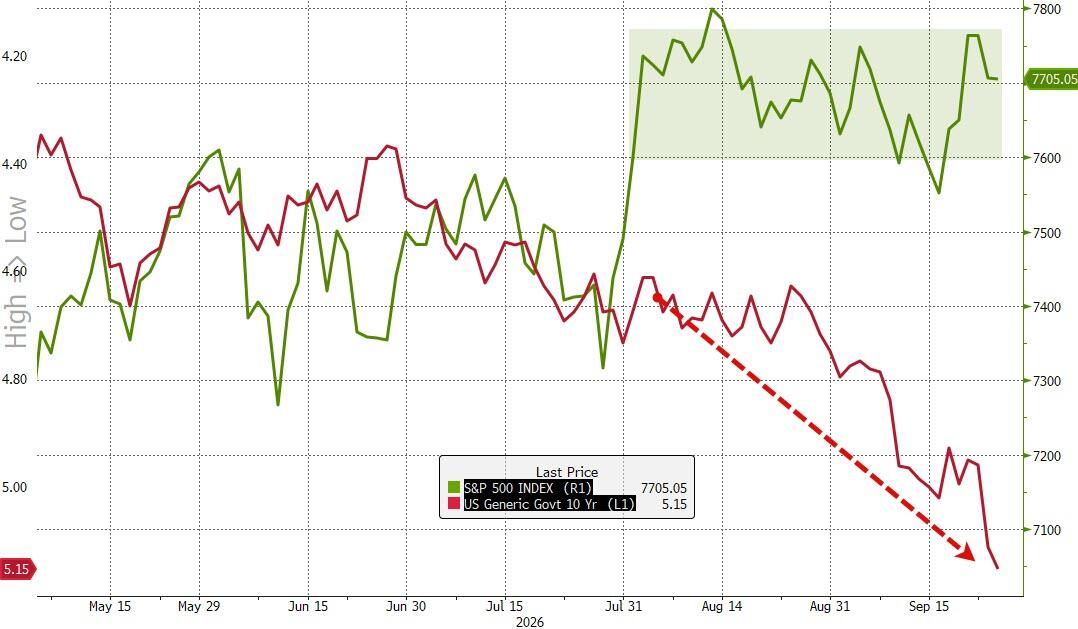
Stocks stumbled again as Treasury yields continued their relentless climb, fueled by expectations that the Fed may have another rate hike in store. The 30-year yield touched 5.446%, while the 10-year surged to 5.22%. A pullback in Oracle didn’t do the tech sector any favors either.
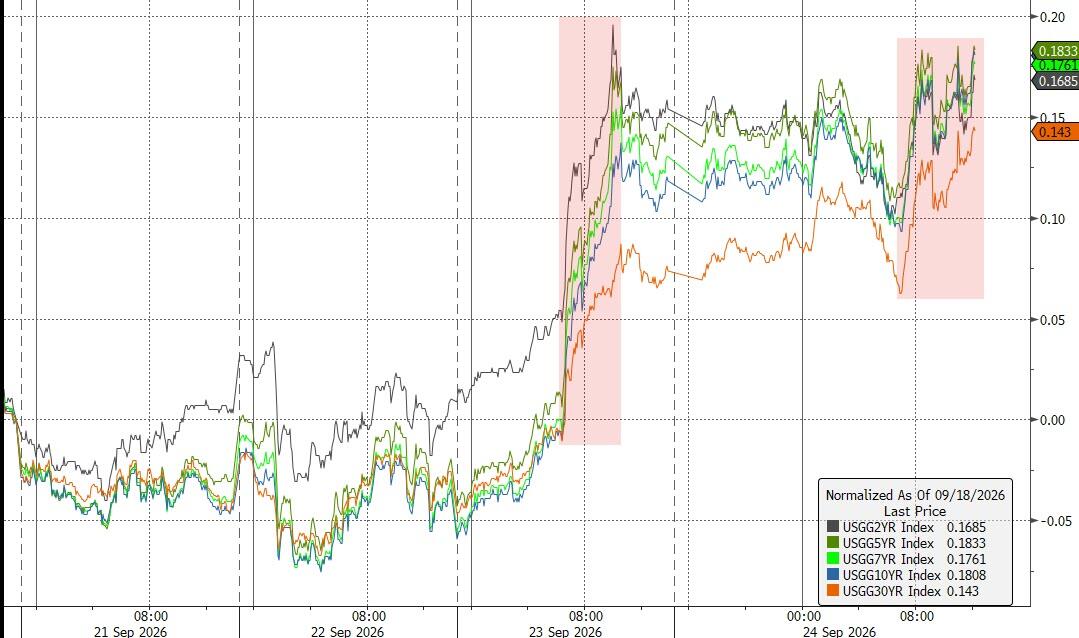
Adding fuel to the inflation fire, oil moved sharply higher, with Brent around $105 and WTI near $93. Fed funds futures now put the odds of another October hike above 70%, so the old “higher for longer” theme seems to have acquired a second wind.
Despite all that, stocks showed surprising resilience. The S&P 500 and Nasdaq clawed their way back to roughly unchanged, erasing their early losses even as bonds continued to get hammered. Apparently, equities haven’t received the memo yet.
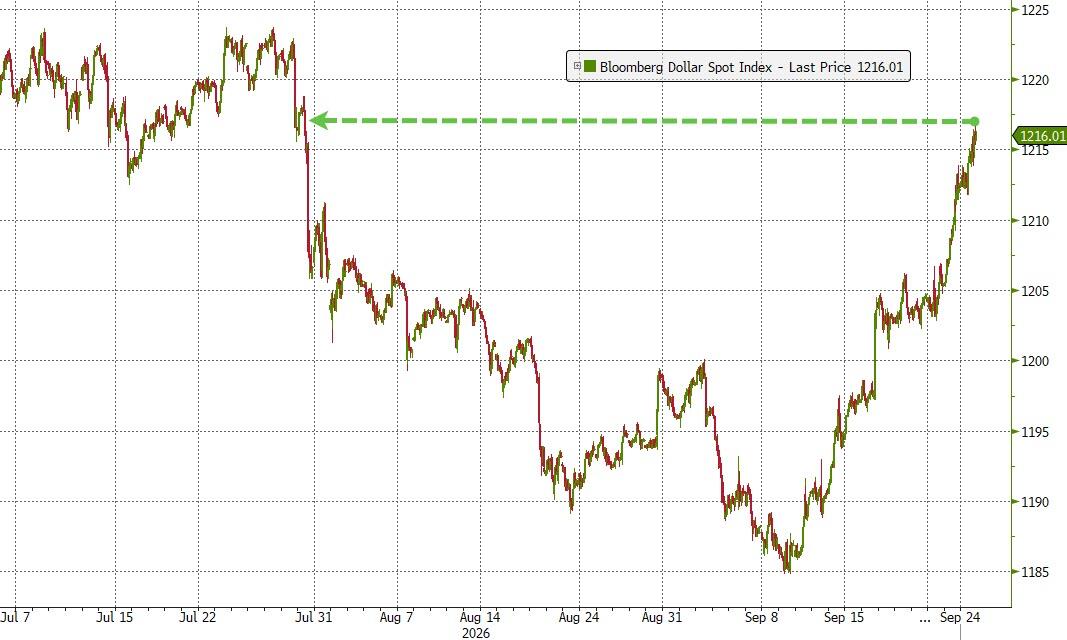
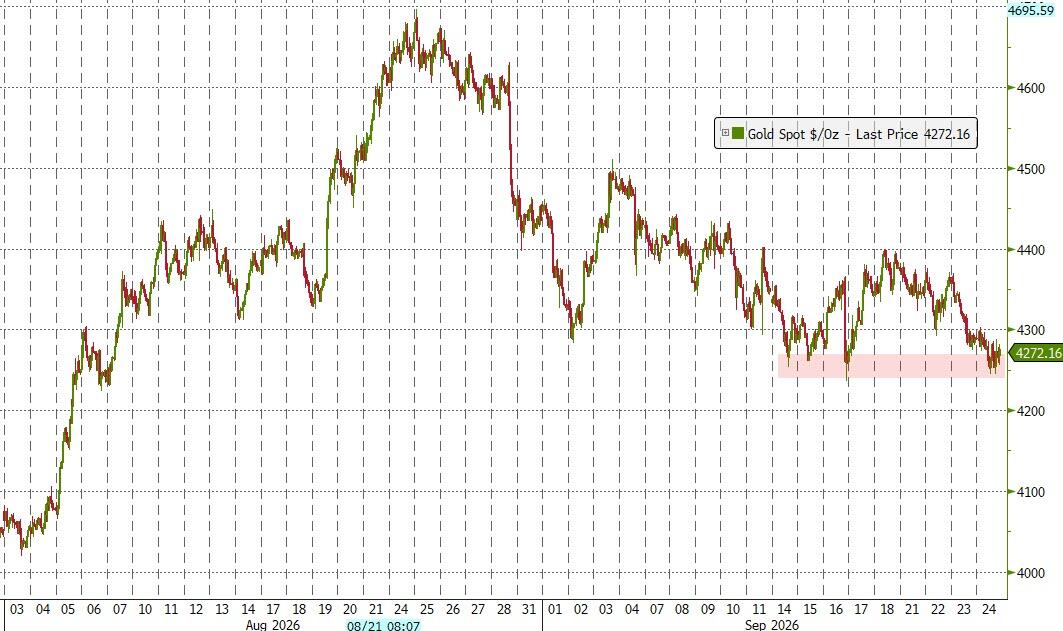
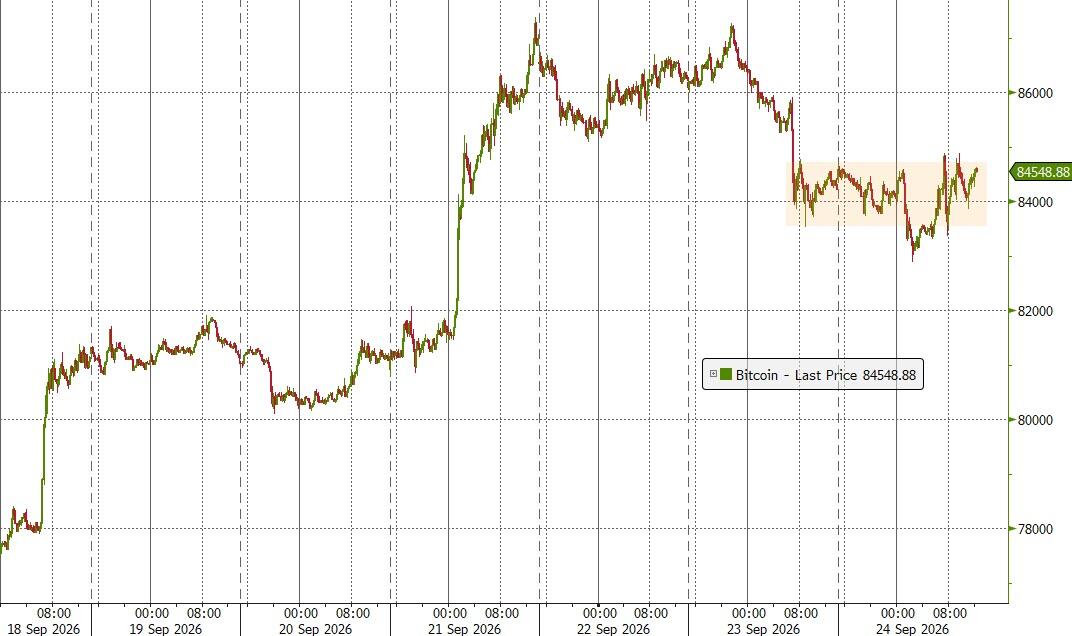
Elsewhere, the dollar strengthened to its highest level since late July, putting additional pressure on gold, which is trying to defend the $4,300 area. Bitcoin, meanwhile, was content to tread water around $84,000.
The bigger question remains the bond market. Stocks have largely shrugged off the surge in yields, but that disconnect can’t continue indefinitely. Either yields eventually retreat, or elevated equity valuations will have to do some adjusting.
On a personal note, I’ll be out tomorrow, so tonight’s StatSheet wraps up the week for me.
When I return, will bond yields have finally taken a breather, or will stocks be the ones waving the white flag?
Continue reading…
2. Current domestic “Buy” Cycle (effective 5/20/2025); International “Buy” Cycle (effective 5/8/25)
Our domestic bullish cycle that began on November 21, 2023, concluded on April 3, 2025, following a market downturn triggered by President Trump’s tariff policy announcement.
This development caused significant declines across major indexes and broader market indices. However, markets subsequently rebounded, culminating in a new domestic “Buy” signal taking effect May 20, 2025.
Concurrently, our International Trend Tracking Index (TTI) experienced parallel volatility. On April 4, 2025, it breached critical thresholds, prompting a “Sell” recommendation. This position reversed as global markets recovered, with the International TTI regaining sufficient momentum to issue a new “Buy” signal effective May 8, 2025.
3. Trend Tracking Indexes (TTIs)
Stocks stumbled out of the gate again but recovered most of their early losses as the session progressed. Metals joined the rebound but fell short of getting back to even.
Our TTIs eased lower as well, though both remain in bullish territory above their trend lines. Rising oil prices and bond yields provided the main headwinds, keeping the bulls from getting too comfortable.
This is how we closed 09/24/2026:
Domestic TTI: +2.57% above its M/A (prior close +3.09%)—Buy signal effective 5/20/25.
International TTI: +3.83% above its M/A (prior close +4.31%)—Buy signal effective 5/8/25.
All linked charts above are courtesy of Bloomberg via ZeroHedge.
———————————————————-
WOULD YOU LIKE TO HAVE YOUR INVESTMENTS PROFESSIONALLY MANAGED?
Do you have the time to follow our investment plans yourself? If you are a busy professional who would like to have his portfolio managed using our methodology, please contact me directly to get more details.
Contact Ulli