A ‘Cold’ CPI Reading Heats Up Markets

Ulli Market Commentary Contact

[Chart courtesy of MarketWatch.com]

  1. Moving the markets

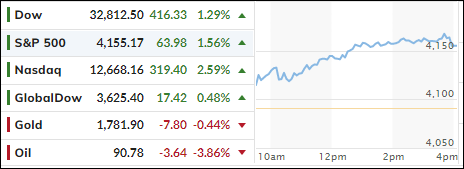
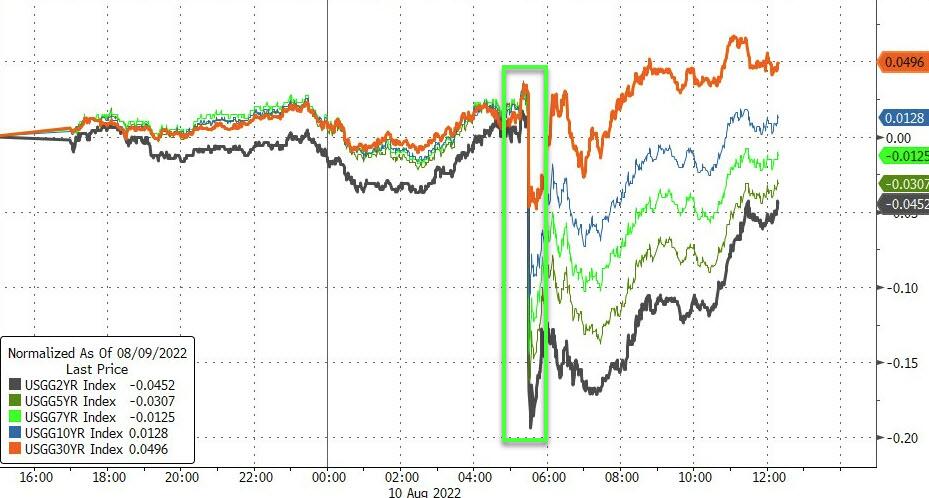
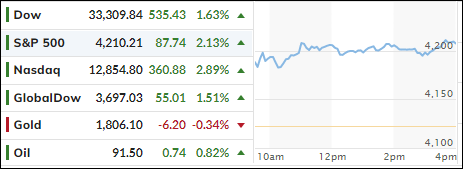
After the anticipated arrival of today’s CPI, which came in at 8.5% YoY, vs. an expected increase of 8.5%, the markets jumped with the Dow gaining some 500 points, a level we closed at.

The bullish ramp showed no weakness during the session, as traders were relieved that the Fed may now back away from its hawkish stance of maintaining the higher rate path. If we continue to see declining inflation prints, the Fed could very well begin to slow the pace of monetary tightening with a Fed pivot eventually taking place.

This assumes that inflation has peaked, which is just as incorrect as the Fed insisting all last year that inflation was transitory. I think the inflation monster has not even been unleashed so far and worse is yet to come. As one analyst so succinctly posted regarding this current CPI reading:

Remember that one month does not make a trend. But also remember that every trend starts with one month.

To me it means, that this July print could be just an outlier, but only time will tell if this is accurate. Unfortunately, real average weekly earnings continue to plunge, as ZeroHedge pointed out, now down 16 straight months, as inflation eats away any wage gains.    

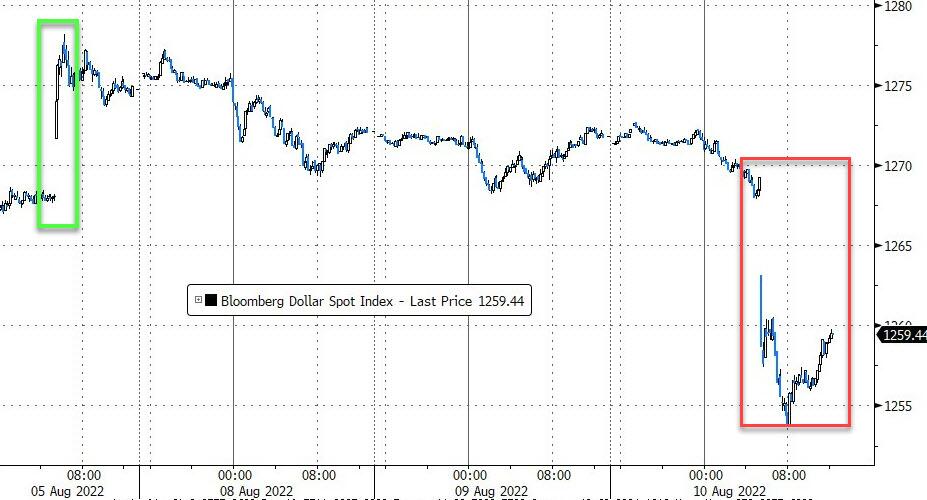
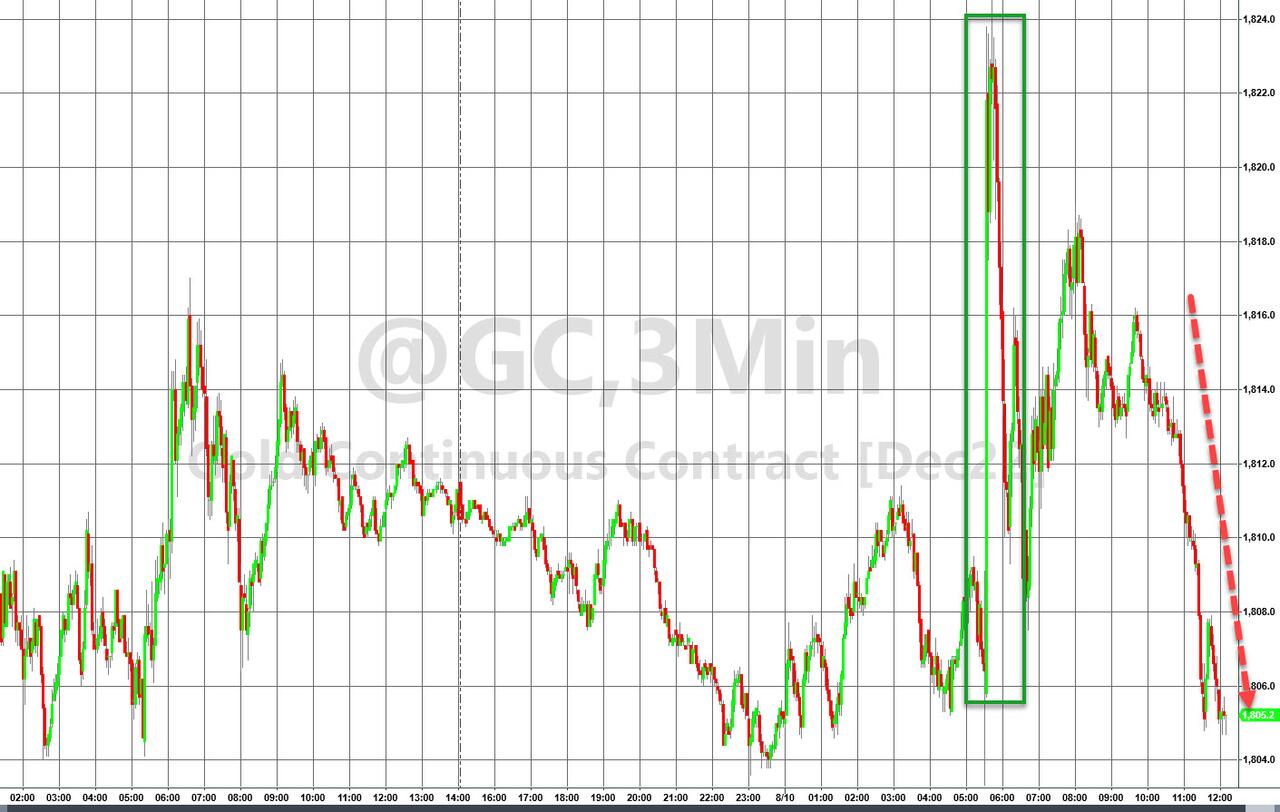
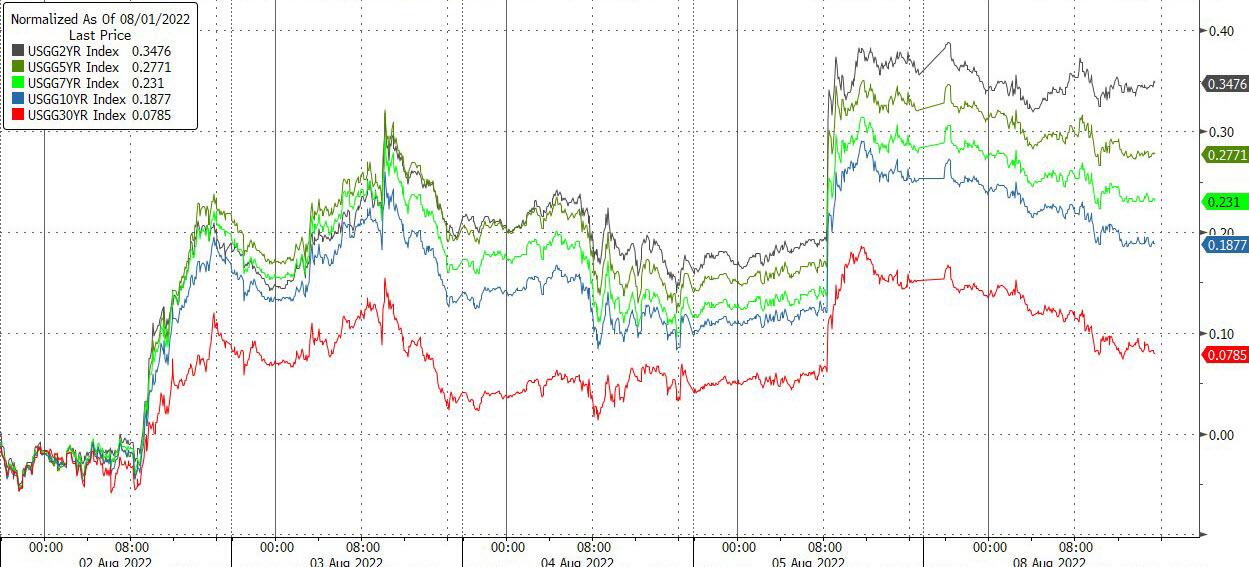
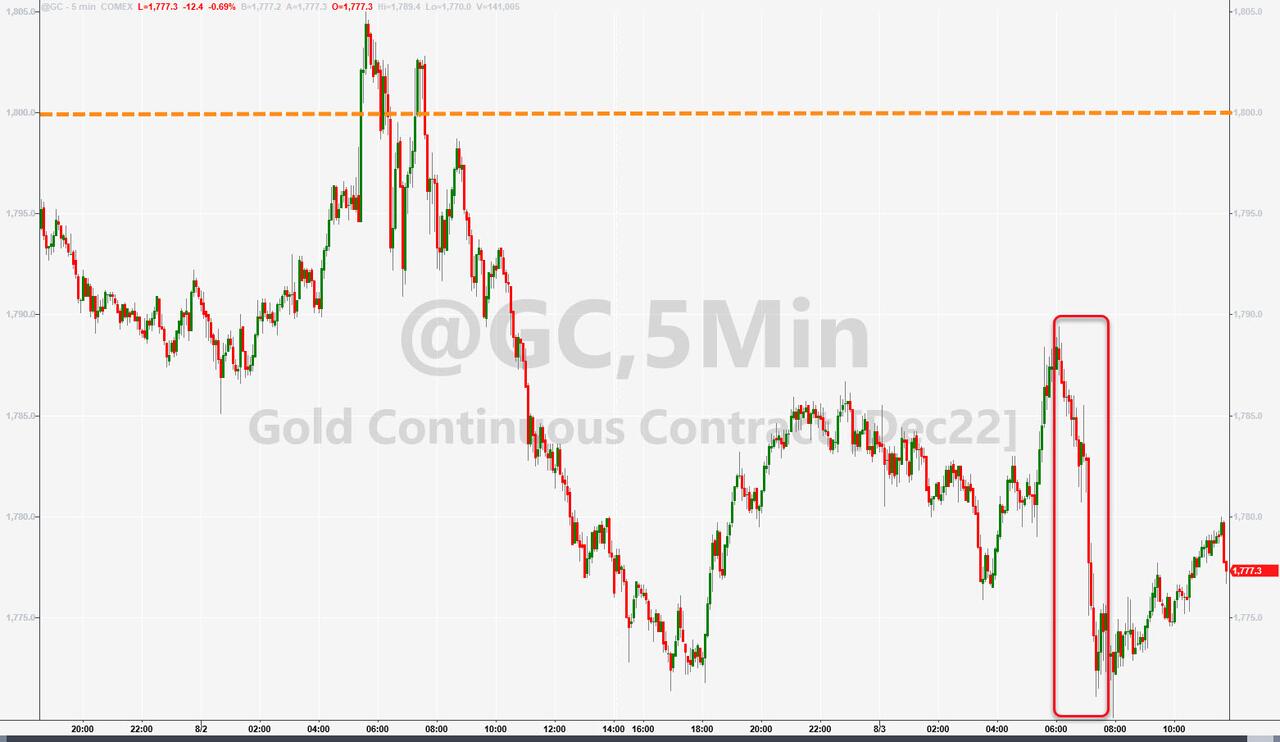
As a result, rate hike odds tumbled instantly, bond yields dipped and ripped with the US Dollar diving and commodities thriving. Gold spiked but gave back some of its early gains yet managed to defend the $1,800 level successfully.

Our Trend Tracking Index (TTI, section 3) befitted as well and has now crawled within striking distance of a new Buy signal.

Read More
Surrendering Early Gains

Ulli Market Commentary Contact

[Chart courtesy of MarketWatch.com]

  1. Moving the markets

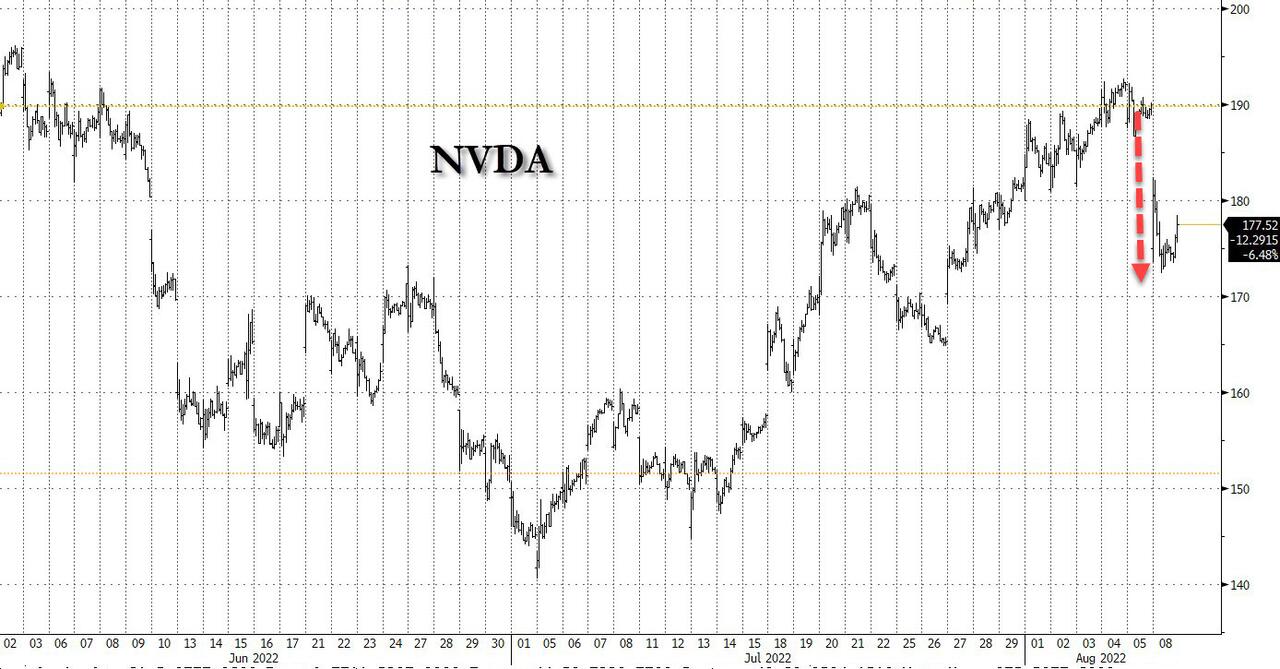
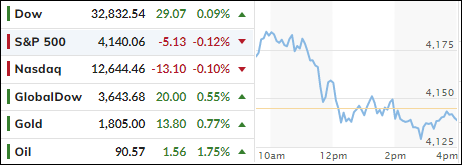
An early rally of some 260 points in the Dow bit the dust, as questions about future demand in the semiconductor industry spoiled the party. Nvidia’s unexpected earnings preannouncement and guidance pulled the stock down by some 8% and cast questions on rival stocks as well.

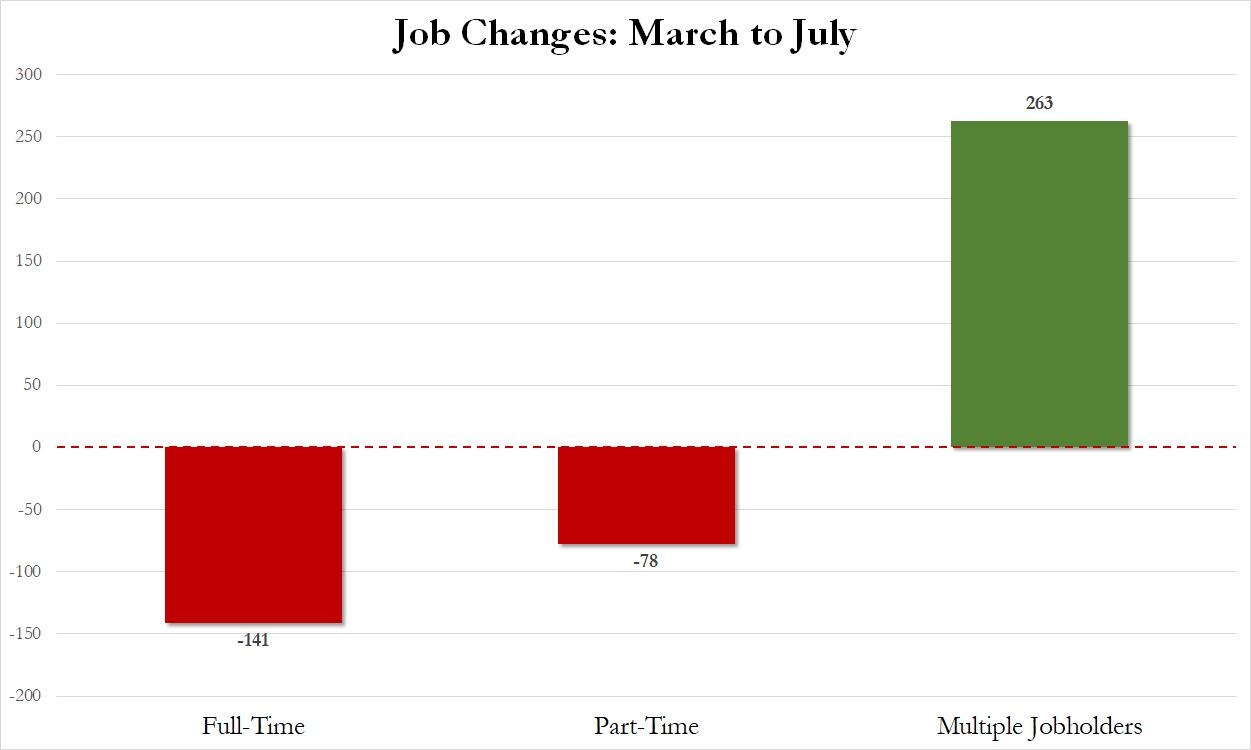
After having had a chance of looking under the hood of last week’s strong labor report, it turns out that some of these numbers are simply not what headline news indicated, but that the true jobs gains are lower, as an increase in multiple job holders distorted the true job growth picture.

Additionally, the reality has set in that the Fed and its mouthpieces have been very clear about their intention of fighting inflation, which means, we are still in a bear market rally with the much hoped-for “low interest rate pivot,” which formed the basis of last month’s rally, nowhere in sight.

Bond yields slipped, as anxiety over Wednesday’s CPI print created even more hesitation, despite expectations being of a “less hot” reading, but nobody can be sure. However, it will give some clarification as to what the Central Bank’s next move will be, when they meet in September.

Read More
ETFs On The Cutline – Updated Through 08/05/2022

Ulli ETFs on the Cutline Contact

Below, please find the latest High-Volume ETF Cutline report, which shows how far above or below their respective long-term trend lines (39-week SMA) my currently tracked ETFs are positioned.

This report covers the HV ETF Master List from Thursday’s StatSheet and includes 312 High Volume ETFs, defined as those with an average daily volume of more than $5 million, of which currently 36 (last week 38) are hovering in bullish territory. The yellow line separates those ETFs that are positioned above their trend line (%M/A) from those that have dropped below it.

Take a look:                                                                   

The HV ETF Master Cutline Report

In case you are not familiar with some of the terminology used in the reports, please read the Glossary of Terms. If you missed the original post about the Cutline approach, you can read it here.      

ETF Tracker Newsletter For August 5, 2022

Ulli Market Commentary Contact

ETF Tracker StatSheet          

You can view the latest version here.

PONDERING A STRONG JOBS REPORT

[Chart courtesy of MarketWatch.com]

  1. Moving the markets

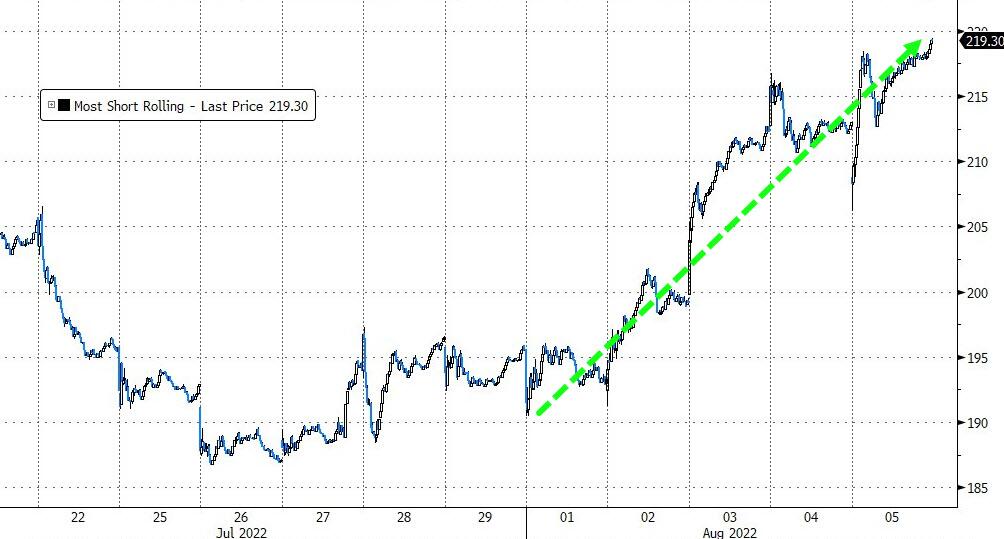
After much anticipation, today’s jobs report came in stronger than expected (528k vs. 258k), which caused an early sell-off, but the major indexes managed to claw back towards their respective unchanged lines, even though uncertainty reigned. However, with the help of the biggest weekly short squeeze since January 2021 any bearish momentum was wiped out.   

The idea that the Fed will have to pivot to lower rates, which was the driver for the recent bear market rally, has traders concerned, as today’s jobs numbers point towards the option I have mentioned before, namely that the Fed may stay in the inflation fighting game a while longer. Chief market strategist Art Hogan, explained it succinctly:

Anybody that jumped on the ‘Fed is going to pivot next year and start cutting rates’ is going to have to get off at the next station, because that’s not in the cards.

With ZeroHedge also throwing cold water on too much enthusiasm:

The crazy thing, of course, is that Wall Street now thinks that the Fed’s tightening phase will be over by December and that the battle against inflation has been won, thereby enabling a new round of rate cutting and soaring stock prices.

Dream on!

Then adding this bon mot:

With a ‘malarkey’ of Fed Speakers all singing from the same hymn sheet – no pivot, we’re battling inflation, don’t expect rate-cuts next year – this morning’s 6-standard-deviation beat in payrolls really stole the jam out of the exuberant donut the market had been hoping for as ‘good news’ was definitely ‘bad news’ from hoping for a dovish Fed to return imminently.

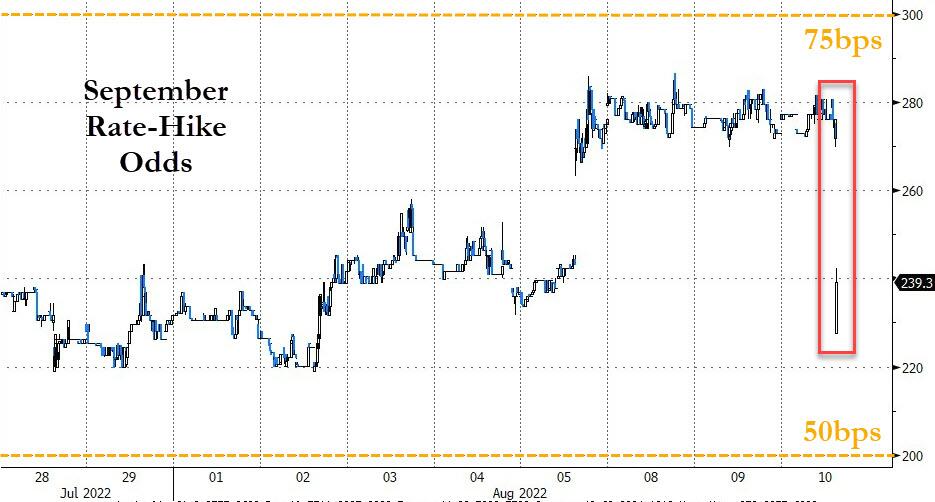
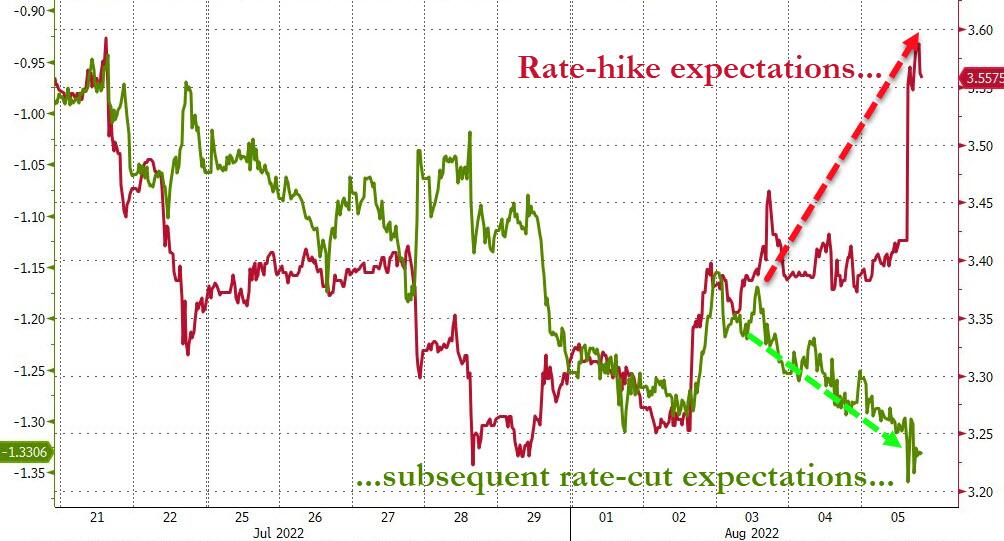
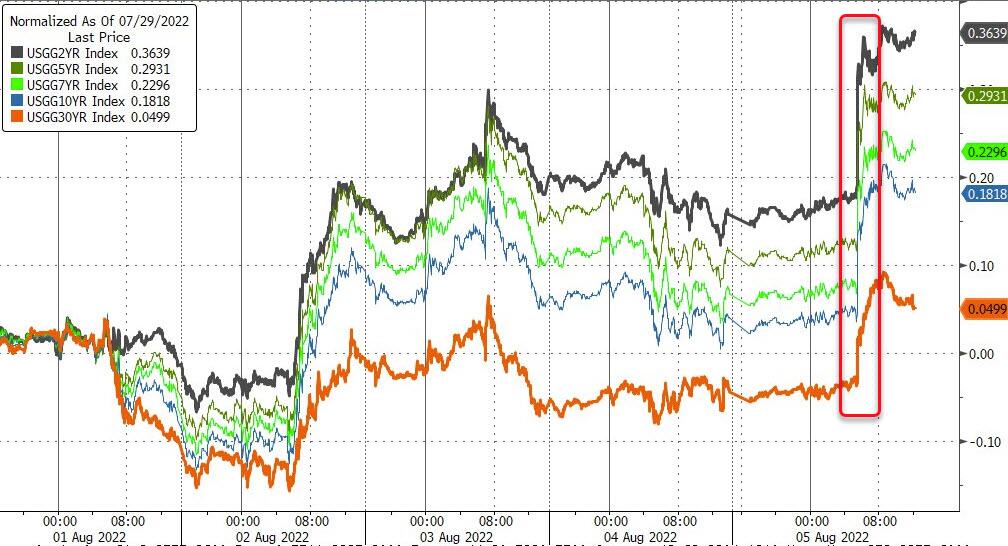
There you have it. The reason for the recent comeback has been annihilated, but it remains to be seen when and how soon the markets will adjust to this new reality, as rate hike expectations soared, and the odds of a 75 bps in September spiked from 25% to 80%.

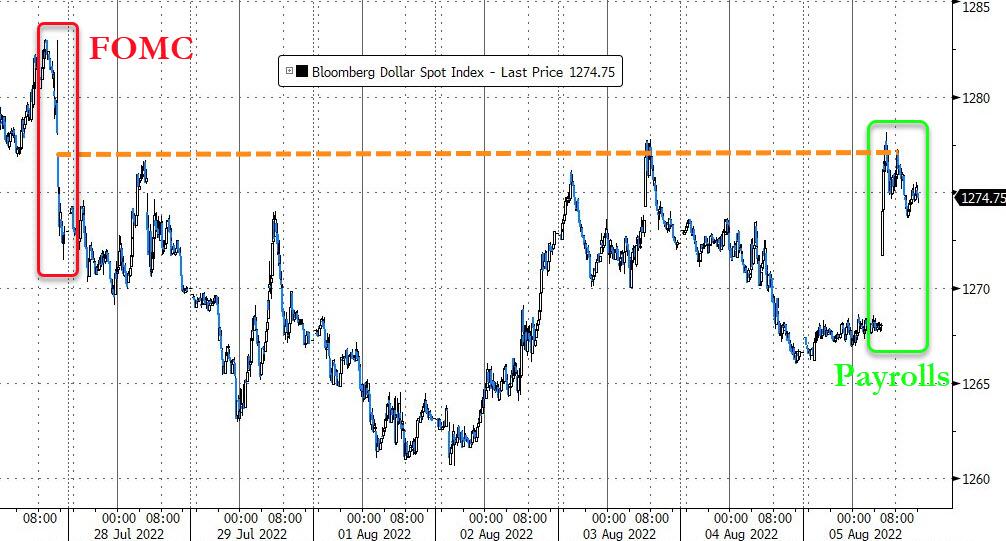
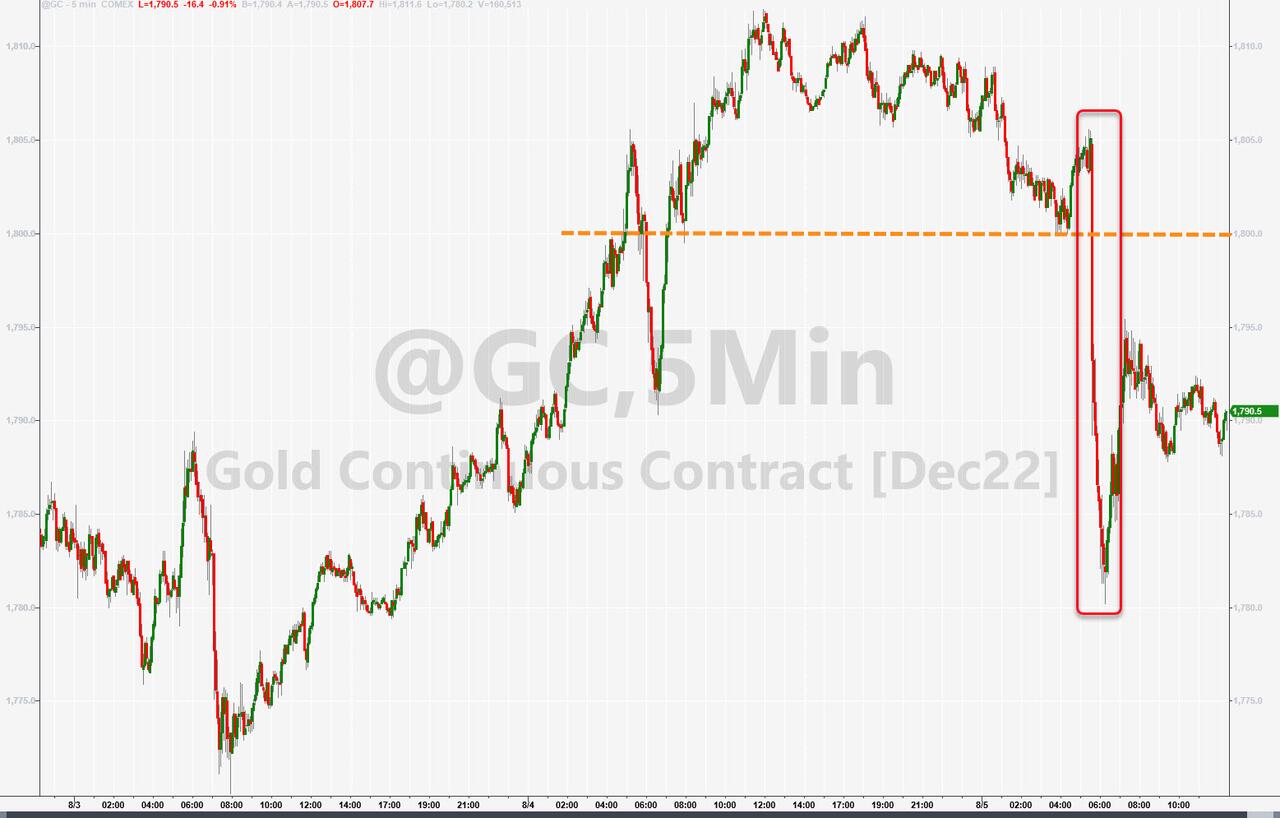
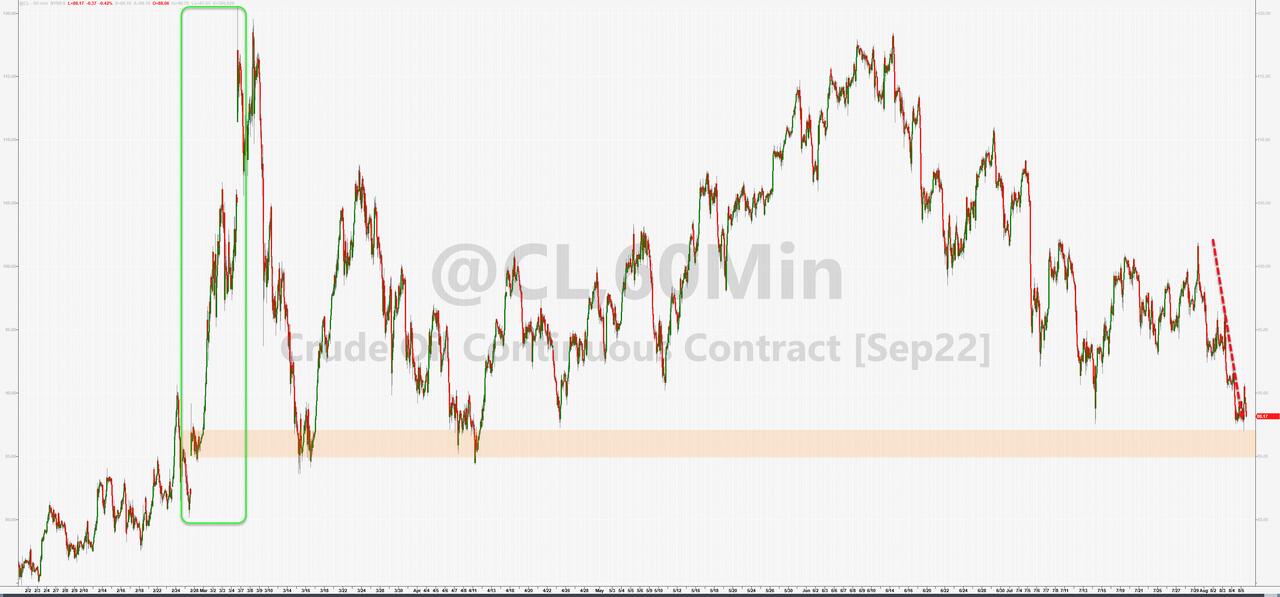
As a result, bond yields ended the week higher with the 10-year closing at 2.84%. Higher rates helped the US Dollar but pulled gold back below its $1,800 level. For the week, Crude oil got hammered and closed at $88.40.  

The question now remains, as ZeroHedge explained with this chart: Will stocks either fall back to reality, or is the Fed about to embark on the greatest flip-flop in history?

Read More

Weekly StatSheet For The ETF Tracker Newsletter – Updated Through 08/04/2022

Ulli ETF StatSheet Contact

ETF Data updated through Thursday, August 4, 2022

Methodology/Use of this StatSheet:

1. From the universe of over 1,800 ETFs, I have selected only those with a trading volume of over $5 million per day (HV ETFs), so that liquidity and a small bid/ask spread are assured.

2. Trend Tracking Indexes (TTIs)

Buy or Sell decisions for Domestic and International ETFs (section 1 and 2), are made based on the respective TTI and its position either above or below its long-term M/A (Moving Average). A crossing of the trend line from below accompanied by some staying power above constitutes a “Buy” signal. Conversely, a clear break below the line constitutes a “Sell” signal. Additionally, I use an 12% trailing stop loss on all positions in these categories to control downside risk.

3. All other investment arenas do not have a TTI and should be traded based on the position of the individual ETF relative to its own respective trend line (%M/A). That’s why those signals are referred to as a “Selective Buy.” In other words, if an ETF crosses its own trendline to the upside, a “Buy” signal is generated. Here too, I recommend trailing sell stop of 12%, or less, depending on your risk tolerance.

If you are unfamiliar with some of the terminology, please see Glossary of Terms and new subscriber information in section 9.     

1. DOMESTIC EQUITY ETFs: SELL — since 02/24/2022

Click on chart to enlarge

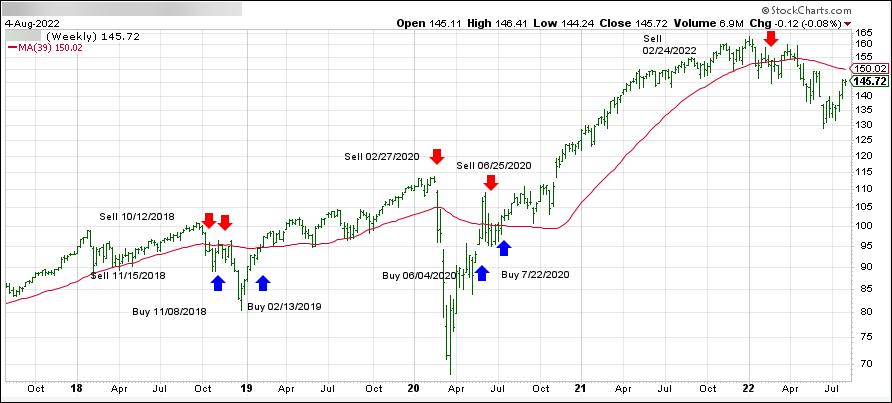
Our main directional indicator, the Domestic Trend Tracking Index (TTI-green line in the above chart) has broken below its long-term trend line (red) by -3.09% and remains in “SELL” mode.  

Read More

Moving Closer To A New “Buy” Signal

Ulli Market Commentary Contact

[Chart courtesy of MarketWatch.com]

  1. Moving the markets

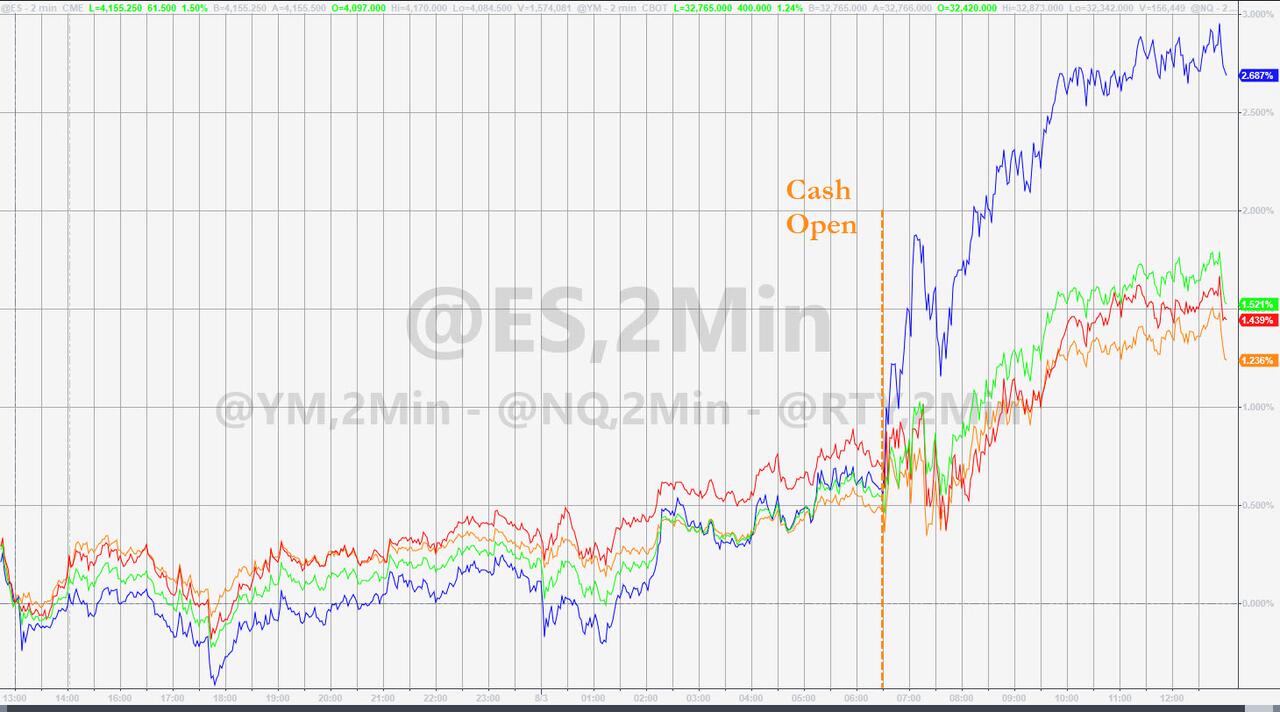
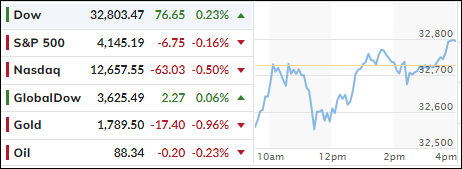
Traders and computer algos marched in sync today by ignoring the fact that the Fed might not be pivoting to lower rates for some time to come, which several Fed heads had made abundantly clear yesterday.

Today, it was St. Louis Fed President Bullard confirming again that “he doesn’t think the US is currently in a recession and that rate hikes to tame high inflation will continue.” That was followed by Neel Kashkari asserting that “2023 rate-cuts seem like a very unlikely scenario.”

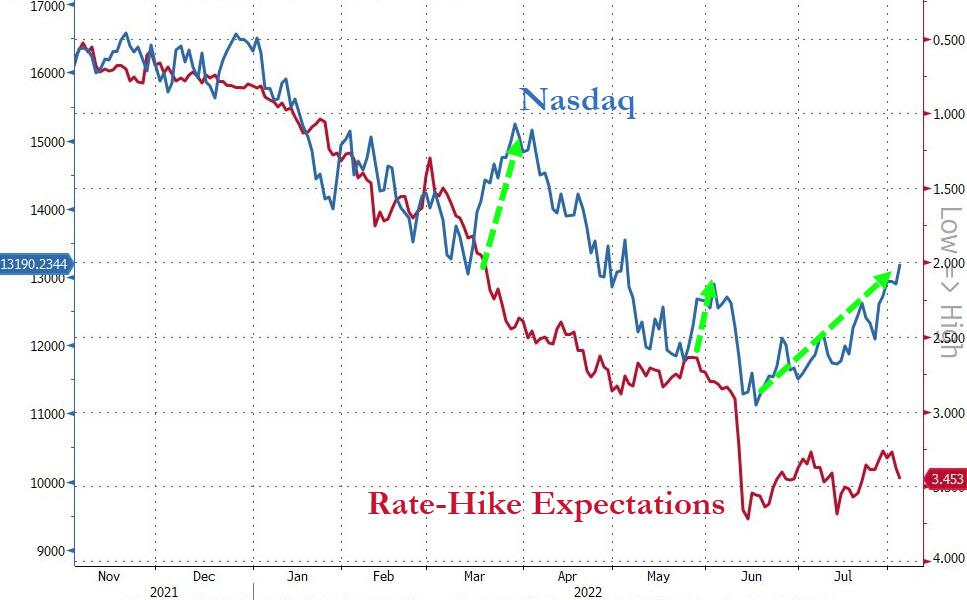
As a result, rate hike expectations soared, yet the markets totally disconnected from that reality, as stocks, for the 3rd time this cycle, decoupled from short term interest rates, making me wonder how long that might last. After all, suddenly, rate hikes are a positive for the markets? Go figure…

As an alternative, investors focused on earnings and better-than-expected economic data (factory orders soared in June) and, with the help of another short squeeze, markets simply ramped higher without looking back, thereby bringing us a step closer to a new “Buy” signal for domestic equities (section 3).

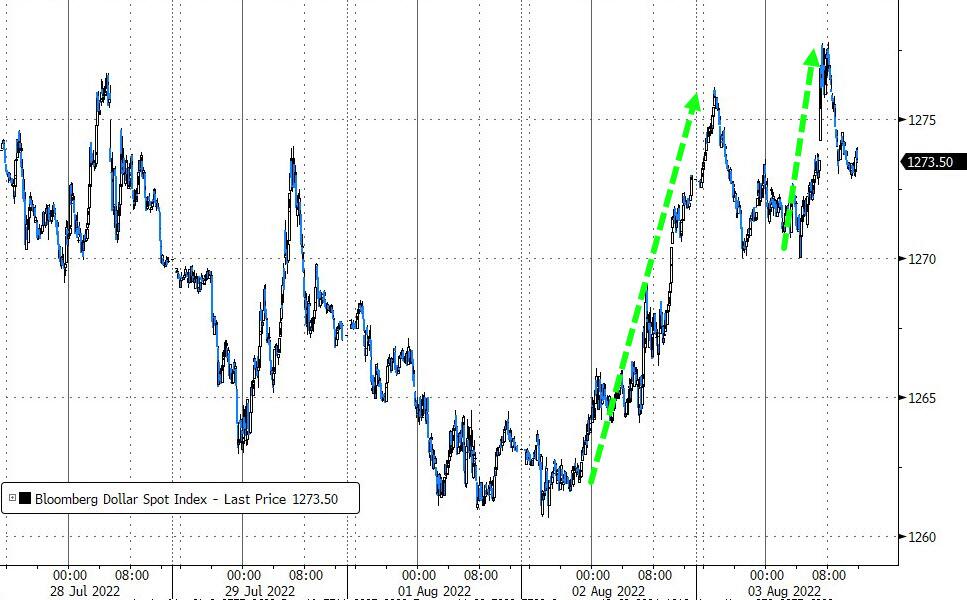
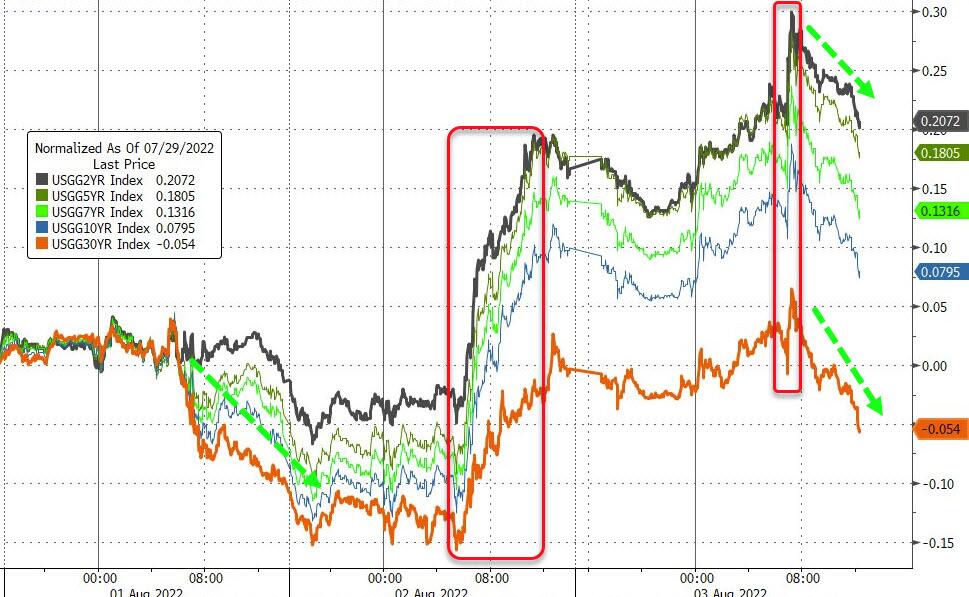
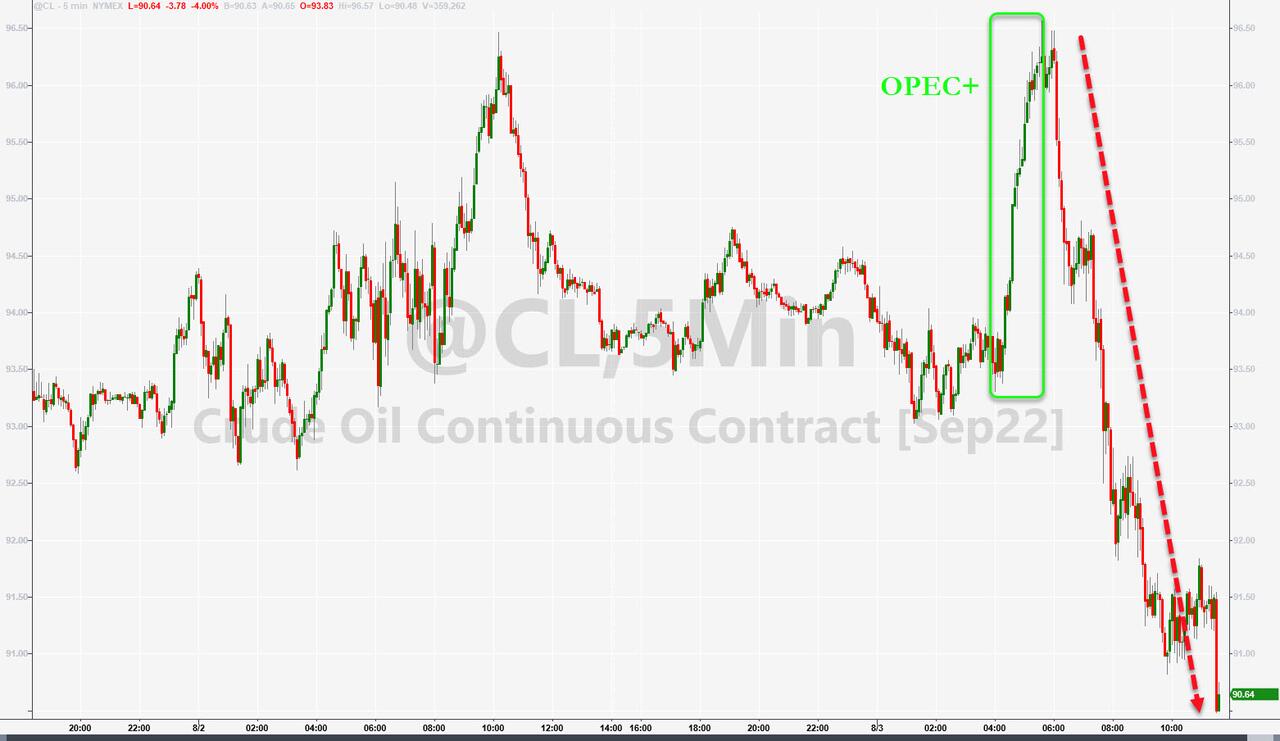
The US Dollar rallied modesty, as bond yields were mixed, gold slipped, while Crude Oil pumped and dumped.

All eyes are on Friday’s jobs report, which will either confirm that things are going in the wrong direction or give support to those opining that strong jobs numbers are holding up the economy.

Read More