
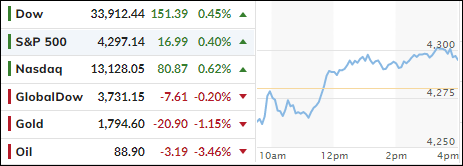
[Chart courtesy of MarketWatch.com]
- Moving the markets
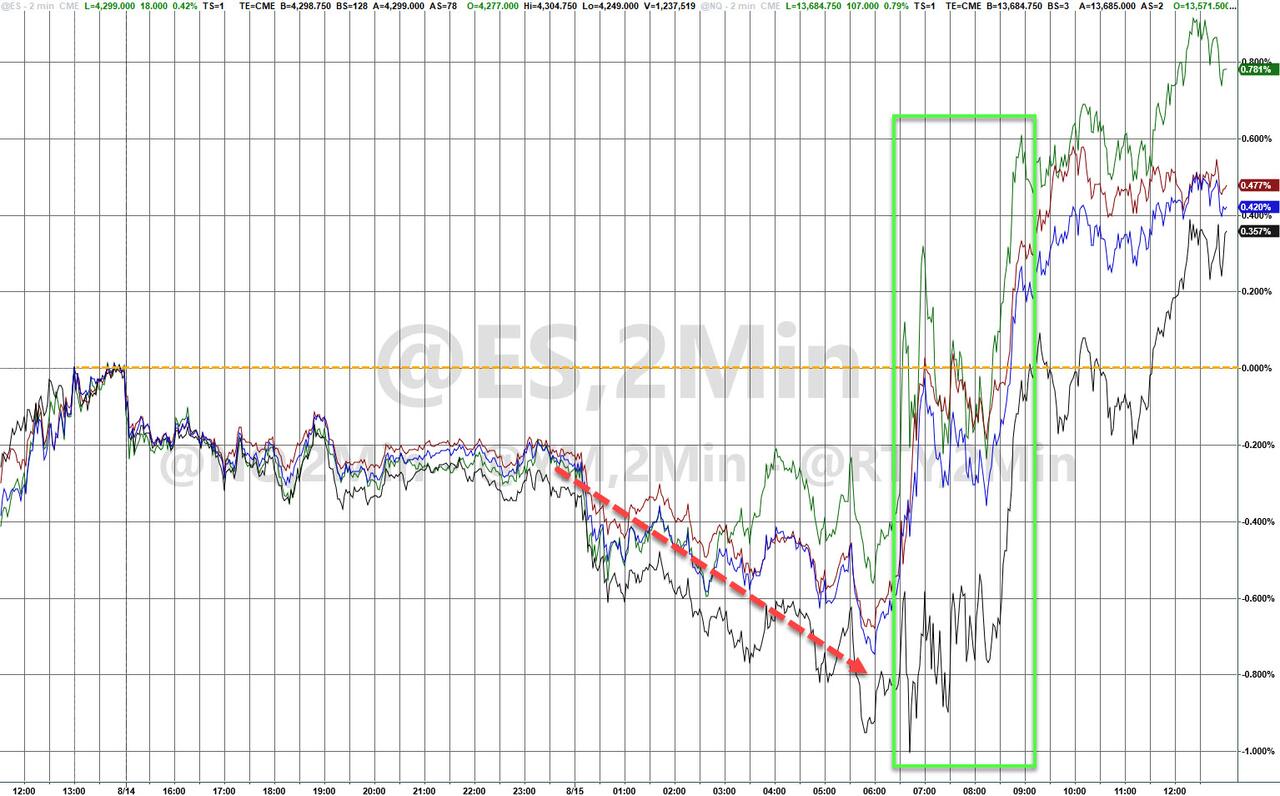
After a sharp opening drop, led by energy and financials, the major indexes reversed course, dug themselves out of a hole and rallied to a green close.
The rebound came despite disappointing economic data out of China, as their Central Bank out of nowhere decided to cut rates, which seems to indicate that their economic recovery may not be all it’s cracked up to be.
On deck this week, here at home, are a slew of retail earnings from powerhouses like Home Depot, Target, and Walmart, with traders especially homing in on news as to how those businesses have been affected by inflation, and more importantly, what type of forward guidance they will be issuing.
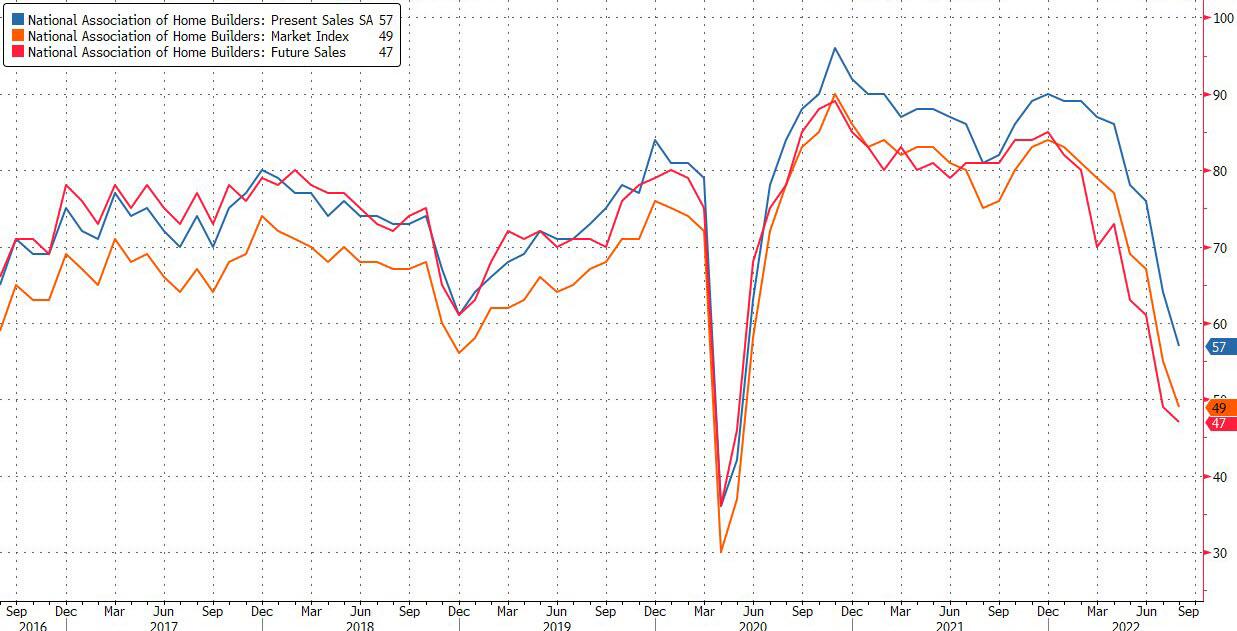
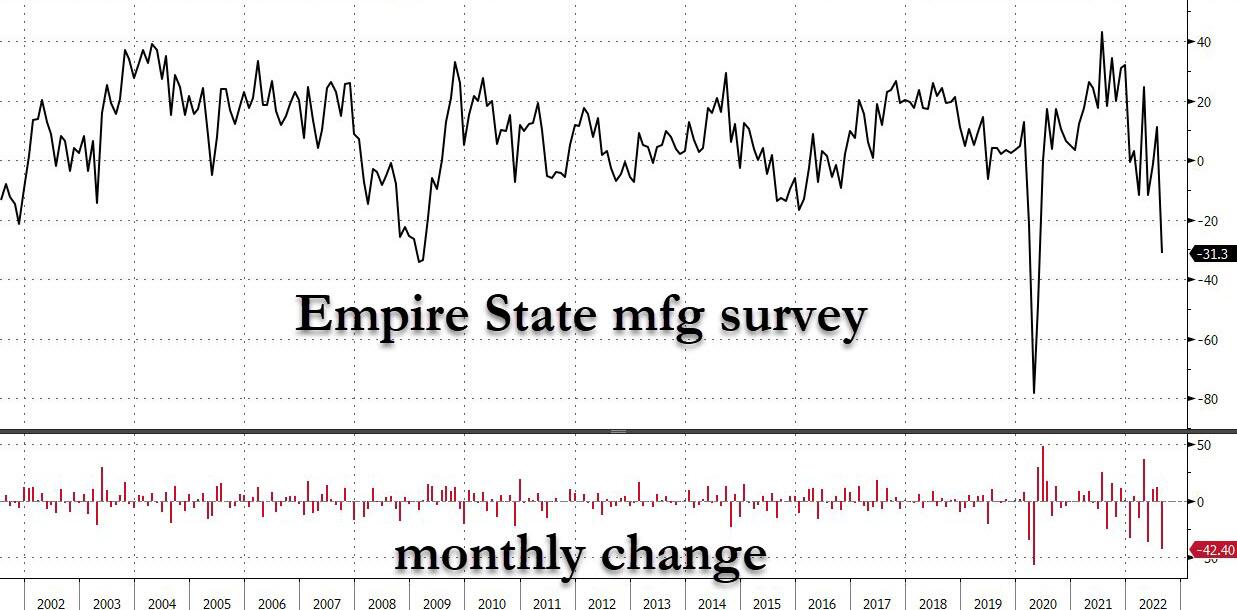
Not helping today’s advance was a thrashing of Homebuilder Confidence, with the index tumbling for the 8th consecutive month, which is its worst slump since the 2007 crash, according to ZeroHedge. The markets also ignored that NY Fed Manufacturing unexpectedly cratered in its second biggest drop on record.
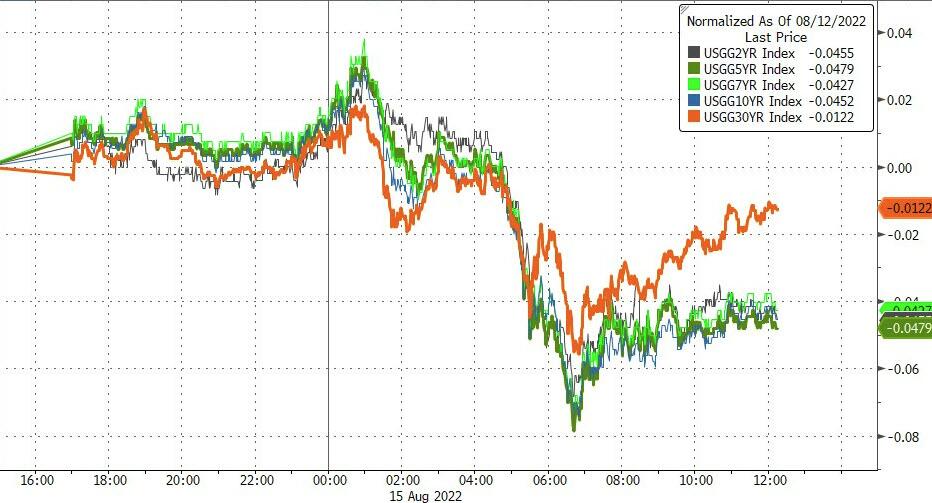
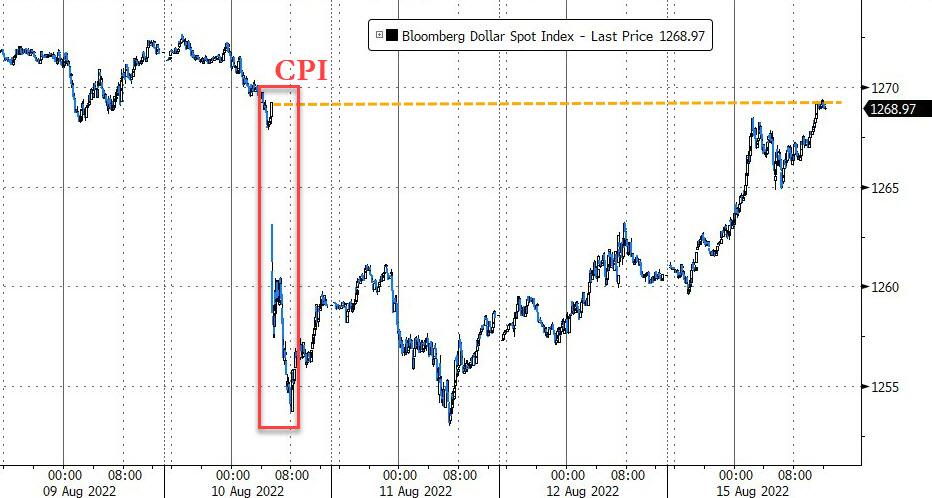
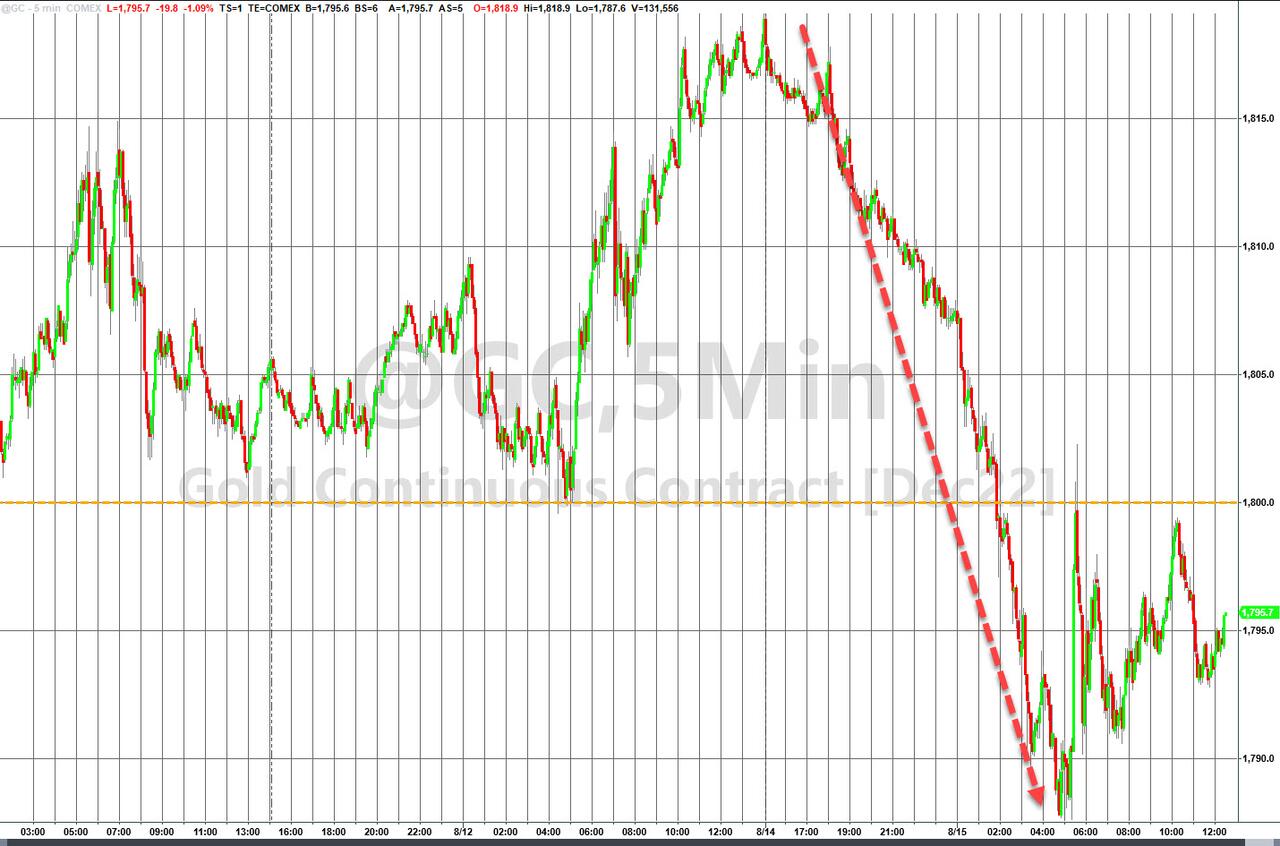
Bond yields dove, The US Dollar retraced its CPI losses, which caused gold to pull back, as the precious metal surrendered its $1,800 level again.
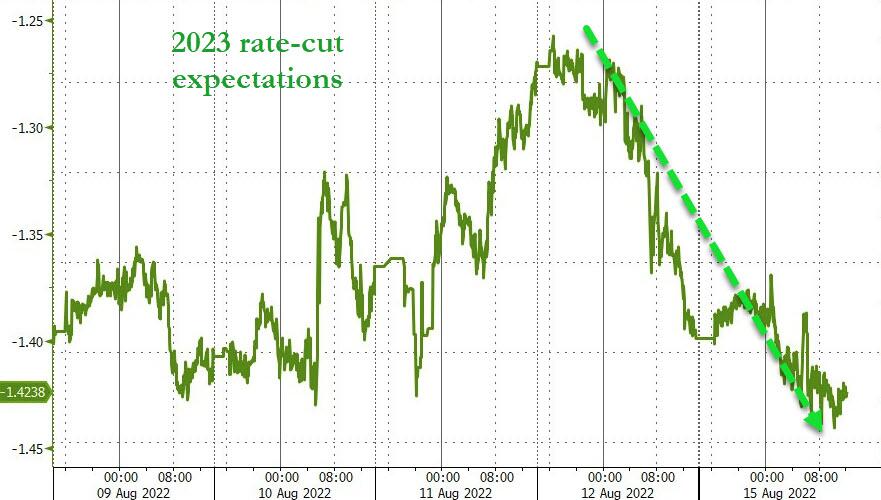
Of course, as we have seen before, all of the bad economic news are a good thing for “easing” (rate cut) expectations, because the up-trend has reversed again, which supports the current bullish theme—but for how long?
2. ETFs in the Spotlight
In case you missed the announcement and description of this section, you can read it here again.
It features some of the 10 broadly diversified domestic and sector ETFs from my HighVolume list as posted every Saturday. Furthermore, they are screened for the lowest MaxDD% number meaning they have been showing better resistance to temporary sell offs than all others over the past year.
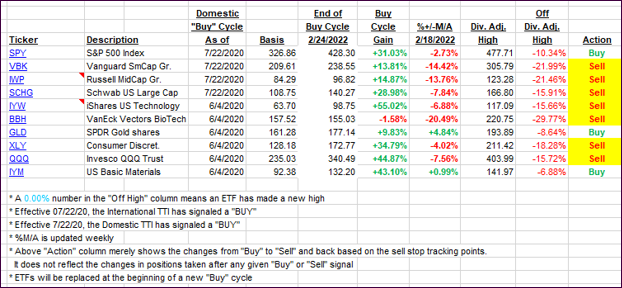
The below table simply demonstrates the magnitude with which these ETFs are fluctuating above or below their respective individual trend lines (%+/-M/A). A break below, represented by a negative number, shows weakness, while a break above, represented by a positive percentage, shows strength.
For hundreds of ETF choices, be sure to reference Thursday’s StatSheet.
For this closed-out domestic “Buy” cycle (2/24/2022), here’s how some of our candidates have fared. Keep in mind that our Domestic Trend Tracking Index (TTI) signaled a “Sell” on that date, which overrode the existing “Buys” shown for SPY and IYM:
Click image to enlarge.
Again, the %+/-M/A column above shows the position of the various ETFs in relation to their respective long-term trend lines, while the trailing sell stops are being tracked in the “Off High” column. The “Action” column will signal a “Sell” once the -12% point has been taken out in the “Off High” column, which has replaced the prior -8% to -10% limits.
3. Trend Tracking Indexes (TTIs)
Our TTIs were mixed with the Domestic one slightly improving on this second day of having conquered its long-term trend line.
This is how we closed 08/15/2022:
Domestic TTI: +1.42% above its M/A (prior close +1.20%)—Sell signal effective 02/24/2022.
International TTI: -4.55% below its M/A (prior close -4.29%)—Sell signal effective 03/08/2022.
Disclosure: I am obliged to inform you that I, as well as my advisory clients, own some of the ETFs listed in the above table. Furthermore, they do not represent a specific investment recommendation for you, they merely show which ETFs from the universe I track are falling within the specified guidelines.
All linked charts above are courtesy of Bloomberg via ZeroHedge.
Contact Ulli