ETFs/Mutual Funds On The Cutline – Updated Through 1/2/2015

Ulli ETFs on the Cutline Contact

Below are the latest ETF Cutline reports, which show how far above or below their respective long-term trend lines (39 week SMA) my currently tracked ETFs/MFs are positioned.

The first report covers the ETF Master List from Thursday’s StatSheet and includes 410 ETFs, of which currently 243 (last week 251) are hovering in bullish territory.

The second report includes only High Volume ETFs. To clarify, High Volume (HV) ETFs are defined as those with an average daily volume of $10 million or higher.

These ETFs are generated from my selected list of some 97 that I use in my advisor practice. It cuts out the “noise,” which simply means it eliminates those ETFs that I would never buy because of their volume limitations. 34 ETFs (last week 35) have managed to remain in bullish territory after the recent market volatility.

The third report covers Mutual Funds on the Cutline. There are currently 338 (last week 422) above the line and 508 below it out of the 846 that I follow.

Take a look:

1. ETF Master Cutline Report

2. ETF High Volume Cutline Report

3. MF Cutline Report

In case you are not familiar with some of the terminology used in the reports, please read the Glossary of Terms.

If you missed the original post about the Cutline approach, you can read it here.

One Man’s Opinion: Will US Stocks Struggle This Year Due To Weak Overseas Growth?

Ulli Market Review Contact

92835431Equity market returns are going to be flat in 2015, says Jim Bianco of Bianco Research LLC. Bloomberg’s own estimate for earnings-growth is down to 6.5 percent – the lowest level since the Great Recession ended in 2008, instead of the usual 10-11 percent.

On top of that, almost every guess at the beginning of the year is too high, so it’s probably going to come even lower than 6.5 percent. Bottom-line: earnings are not going to be good this year and the estimates are for a very poor earnings year.

Additionally, if the Fed raises rates – which they are unlikely to do, but if they manage to raise rates, falling earnings expectations and elevated rates would be a cocktail for poor stock market, he observed.

Read More

New ETFs On The Block: Flexshares Credit-Scored US Corporate Bond Index Fund (SKOR)

Ulli Bond ETFs Contact

95551488FlexShares, the tenth-largest US exchange-traded fund issuer better known for its suite of “smart-beta” and self-indexed funds, recently launched a US-focused fixed-income fund that puts the spotlight on the middle-maturity offerings.

Northern Trust’s ETF-unit unveiled the FlexShares Credit-Scored US Corporate Bond Index Fund (SKOR), an intermediate-dated bond-fund that focuses on investment-grade corporate bonds with maturities ranging from two to 10 years.

SKOR tracks the Northern Trust Credit-Scored US Corporate Bond Index, an enhanced beta index developed by the fund’s own index shop that aims to lower various systematic and idiosyncratic risks.

Read More

01-02-2015

Ulli Newsletter Archives Contact

ETF/No Load Fund Tracker Newsletter For January 2, 2015

ETF/No Load Fund Tracker StatSheet

————————————————————-

THE LINK TO OUR CURRENT ETF/MUTUAL FUND STATSHEET IS:

https://theetfbully.com/2014/12/weekly-statsheet-for-the-etfno-load-fund-tracker-newsletter-updated-through-12312014/

————————————————————

Market Commentary

Friday, January 2, 2015

SLIPPING AND SLIDING INTO THE NEW YEAR
Fri pic

[Chart courtesy of MarketWatch.com]

1. Moving the Markets

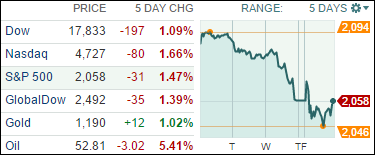
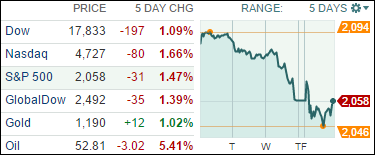
Stocks ended mixed in 2015’s first day of trading. The S&P 500 was down about 0.03%, the Nasdaq dropped 0.20%, while the Dow gained a slight 0.06%, however, the numbers were negative over the past week as the chart shows.

A mixed batch of economic data was likely the culprit that made markets stagger. Construction spending fell 0.3% for November, which was surprising to many analysts. Also, the growth in the U.S. manufacturing sector slipped to a 6-month low in December.

It seems fitting, as we start the New Year, to discuss one of the biggest market movers of 2014 – Oil. As you probably all know, oil “tanked” in the second half of 2014. The black gold dropped 46% for the year and is now at a 5 ½ year low.

The winners and losers relating to oil? Airlines and offshore drillers. Southwest Airlines (LUV) was the biggest gainer, soaring 124% last year. Transocrean (RIG) was the biggest loser sinking 63%.

It will be interesting to see how markets get back in swing for the first full week of trading next week. Let’s stay tuned.

5 of our 10 ETFs in the Spotlight managed to close up in today’s see-saw session but no new highs were made as section 3 shows.

2. ETFs in the Spotlight

In case you missed the announcement and description of this section, you can read it here again.

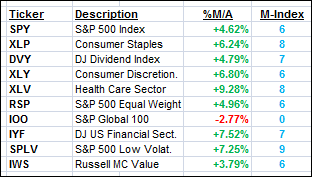
It features 10 broadly diversified ETFs from my HighVolume list as posted every Monday. Furthermore, they are screened for the lowest MaxDD% number meaning they have been showing better resistance to temporary sell offs than all others over the past year.

Here are the 10 candidates:
MaxDD

The above table simply demonstrates the magnitude with which some of the ETFs are fluctuating in regards to their positions above or below their respective individual trend lines (%M/A). A break below, represented by a negative number, shows weakness, while a break above, represented by a positive percentage, shows strength.

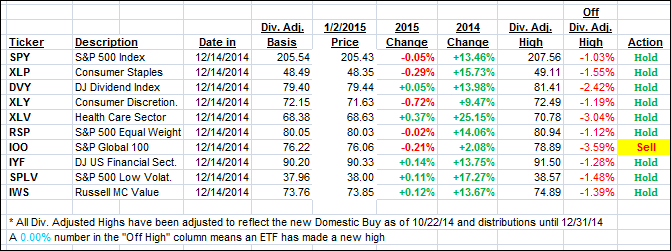
Year to date, here’s how the above candidates have fared so far:
YTD

Again, the first table above shows the position of the various ETFs in relation to their respective long term trend lines (%M/A), while the second one tracks their trailing sell stops in the “Off High” column. The “Action” column will signal a “Sell” once the -7.5% point has been taken out in the “Off High” column.

3. Trend Tracking Indexes (TTIs)

Our Trend Tracking Indexes (TTIs) stumbled this week with the International one again sliding below its trend line. This indicator has been whipsawing for some time now, and it remains to be seen if this is a sign of more downside to come.

Here’s how we ended this week:

Domestic TTI: +2.65% (last Friday +3.21%)—Buy signal since 10/22/2014

International TTI: -0.88% (last Friday -0.20%)—New Sell signal effective 12/15/14

Have a nice weekend.

Ulli…

Disclosure: I am obliged to inform you that I, as well as advisory clients of mine, own some of these listed ETFs. Furthermore, they do not represent a specific investment recommendation for you, they merely show which ETFs from the universe I track are falling within the guidelines specified.

————————————————————-

READER Q & A FOR THE WEEK

All Reader Q & A’s are listed at our web site!
Check it out at:

http://www.successful-investment.com/q&a.php

Reader Freden:

Q: Ulli: First of all Happy Holidays and a prosperous 2015.  I enjoy your website and information very much.

Now for my question:  When the international TTI crossed into the positive on 11/24 what made you decide against investing in international broad based ETFs?  I know you had mixed feelings about international stocks, but the trend said “buy”. How do you know when to follow your instinct, and when to follow the trend?  This applies to both buying and selling…

Look forward to hearing your thoughts…thanks and best regards!

A: Freden: Yes, while I have had a negative bias towards the international arena, my main reasons were twofold:

1. We were at the time of the International TTI crossing to the positive 100% invested, and I did not want to disturb our allocations since they were performing well.

2. When reviewing the international section in the StatSheet (section 5), I saw far more negative (red) momentum numbers than in any other area indicating continued weakness.

In the end, it was not my instinct but these facts that kept me out.

———————————————————-

WOULD YOU LIKE TO HAVE YOUR INVESTMENTS PROFESSIONALLY MANAGED?

Do you have the time to follow our investment plans yourself? If you are a busy professional who would like to have his portfolio managed using our methodology, please contact me directly or get more details at:

https://theetfbully.com/personal-investment-management/

———————————————————

Back issues of the ETF/No Load Fund Tracker are available on the web at:

https://theetfbully.com/newsletter-archives/

ETF/No Load Fund Tracker Newsletter For January 2, 2015

Ulli ETF Tracker Contact

ETF/No Load Fund Tracker StatSheet

————————————————————-

THE LINK TO OUR CURRENT ETF/MUTUAL FUND STATSHEET IS:

https://theetfbully.com/2014/12/weekly-statsheet-for-the-etfno-load-fund-tracker-newsletter-updated-through-12312014/

————————————————————

Market Commentary

Friday, January 2, 2015

SLIPPING AND SLIDING INTO THE NEW YEAR

Fri pic

[Chart courtesy of MarketWatch.com]

1. Moving the Markets

Stocks ended mixed in 2015’s first day of trading. The S&P 500 was down about 0.03%, the Nasdaq dropped 0.20%, while the Dow gained a slight 0.06%, however, the numbers were negative over the past week as the chart shows.

A mixed batch of economic data was likely the culprit that made markets stagger. Construction spending fell 0.3% for November, which was surprising to many analysts. Also, the growth in the U.S. manufacturing sector slipped to a 6-month low in December.

It seems fitting, as we start the New Year, to discuss one of the biggest market movers of 2014 – Oil. As you probably all know, oil “tanked” in the second half of 2014. The black gold dropped 46% for the year and is now at a 5 ½ year low.

The winners and losers relating to oil? Airlines and offshore drillers. Southwest Airlines (LUV) was the biggest gainer, soaring 124% last year. Transocrean (RIG) was the biggest loser sinking 63%.

It will be interesting to see how markets get back in swing for the first full week of trading next week. Let’s stay tuned.

5 of our 10 ETFs in the Spotlight managed to close up in today’s see-saw session but no new highs were made as section 3 shows.

Read More

Weekly StatSheet For The ETF/No Load Fund Tracker Newsletter – Updated Through 12/31/2014

Ulli ETF StatSheet Contact

ETF/Mutual Fund Data updated through Wednesday, December 31, 2014

TOC 121514

If you are not familiar with some of the terminology used, please see the Glossary of Terms.


1. DOMESTIC EQUITY MUTUAL FUNDS/ETFs: BUY — since 10/22/2014

TTI

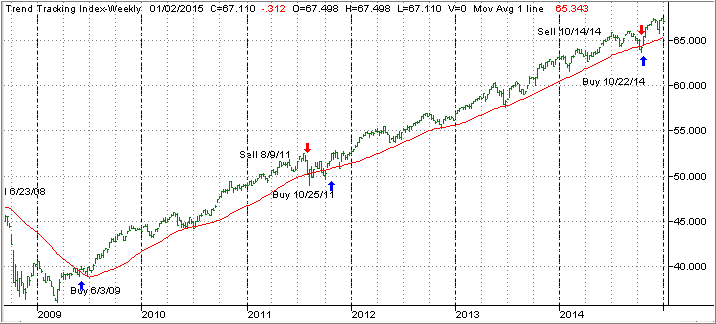
Our main directional indicator, the Domestic Trend Tracking Index (TTI), broke through its long-term trend line generating a “Sell” for this arena effective 10/14/2014, which was followed by a violent break back above the line on 10/22/14 generating a new “Buy.” It was a classic whipsaw signal, and you can read more on my blog as to the events as they were unfolding.

As of today, our TTI (green line in above chart) is positioned above its long term trend line (red) by +2.85% keeping us in the market with newly established positions.

Read More