
1. Moving the Markets
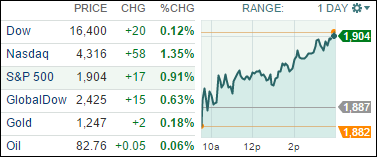
U.S. markets are coming off another wild week of trading, where the Dow saw its most volatile period since 2011. The S&P 500 ended the day up 0.91%, the Dow gained 0.12% after a late-day rally and the Nasdaq posted a 1.35% gain. Investors have been nervous over the spread of Ebola of recent; however, there was a sigh of relief over the weekend when fears surrounding the virus lessened as no new cases were reported.
Over the past three weeks investors have been hoping for some solid earnings reports to act as a stabilizing agent to all of the volatility in the markets. Heading into Monday, 64% of the 81 companies that have reported earnings have topped expectations, which is above the long-term average of 63%, according to Thomson Reuters.
We saw great numbers from Chipotle (CMG) that topped expectations today, but the stars didn’t align for IBM however. The company came out with a weak quarterly earnings report that missed expectations by a wide margin. Shares fell more than 7% to $168.81 and were a big drag on the Dow. This week, 128 S&P 500 companies and 12 Dow names report earnings.
With the markets having bounced back for 2 days in a row, our Domestic TTI has inched back above its long-term trend line by a fraction; however, it’s not enough to change our current investment stance. See section 3 for more details.
Technically speaking, the S&P 500 is bouncing against overhead resistance at 1,905 while also attempting to conquer its widely followed 200 day MA. For some detailed analysis please read “How far will the stock market rebound go?”
2. ETFs in the Spotlight
In case you missed the announcement and description of this section, you can read it here again.
It features 10 broadly diversified ETFs from my HighVolume list as posted every Monday. Furthermore, they are screened for the lowest MaxDD% number meaning they have been showing better resistance to temporary sell offs than all others over the past year.
Here are the 10 candidates:
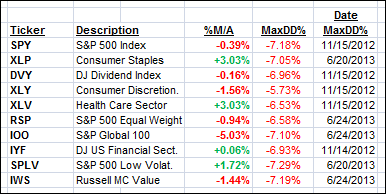
While our Trend Tracking Indexes (TTIs) are in “Sell” mode, I am featuring this table to simply demonstrate the magnitude with which some of the ETFs are fluctuating in regards to their positions above or below their respective individual trend lines (%M/A).
Year to date, here’s how the above candidates have fared so far:
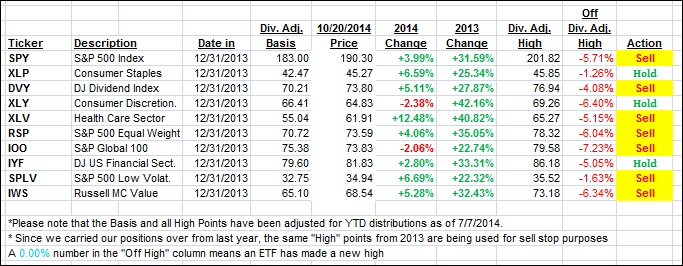
To be clear, the first table above shows the position of the various ETFs in relation to their respective long term trend lines (%M/A), while the second one tracks their trailing sell stops in the “Off High” column. The “Action” column will signal a “Sell” once the -7.5% point has been taken out in the “Off High” column.
The “Action” column has been modified to show the effects of our Sell signals. The current “Hold” positions reflect only sector ETFs, which should be sold based on their respective sell stop points.
3. Domestic Trend Tracking Indexes (TTIs)
Our Trend Tracking Indexes (TTIs) present a mixed picture today. While the International one is clearly stuck in bear market territory, the Domestic one managed to crawl back above its long-term trend line by a fraction of a percent.
This move certainly was not convincing enough to cause a change in our current position of being out of the market. I view it still as part of a dead cat bounce until proven otherwise. As I pointed out last Friday, I need to see a clear break above the line, along with some staying power, before I would change my mind again and turn bullish.
Right now, we are stuck sort of in no-man’s land where major trend direction is uncertain, and we need to see confirmation of a new trend before we can make any fresh commitments.
Here’s how we ended up:
Domestic TTI: +0.30% (last close -0.22%)—Sell signal since 10/14/2014
International TTI: -4.09% (last close -4.75%)—Sell signal since 10/1/2014
Disclosure: I am obliged to inform you that I, as well as advisory clients of mine, own some of these listed ETFs. Furthermore, they do not represent a specific investment recommendation for you, they merely show which ETFs from the universe I track are falling within the guidelines specified.
Contact Ulli