
1. Moving the Markets
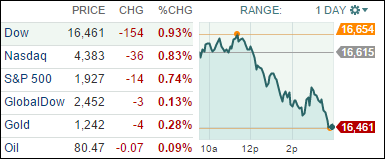
Markets fell from their 4-day winning streak today as the S&P 500 gave back 0.74%, the Dow dropped 0.93% and the Nasdaq declined 0.83%. The Dow is now officially back in the red for the year. Despite the slide today, the market remains in better shape than it was a week earlier, when a day of tumultuous trading briefly had the Dow down 460 points for the day and the S&P in the red for 2014 before a late-day recovery erased much of the losses.
In earnings reports, Yahoo (YHOO) posted earnings late yesterday that topped estimates. Shares rose more than 4.5% today. Apple (AAPL) set a new $104.11 intraday high and shares continue to rise as strong iPhone sales linger on. Wall Street analysts remain very bullish on the stock, holding out an 18-month price target of $115.52. On the flip side, shares of AT&T fell 2% today after lowering their revenue outlook for the year and posting earnings that missed analyst estimates.
Markets fared well in Europe today though, with the FTSE 100, DAX and CAC 40 all gaining. Investors remain optimistic that the European Central Bank may inject stimulus into the region to counter slowing growth.
Let’s not forget that after the severe slide last week, the markets received 2 assists in form of a Fed official jawboning about a change of heart in regards to the ending of QE while yesterday the rumor of potential ECB bond buying kicked the rally into high gear.
What that means is that we’re floating on hot air and hype; nevertheless, the markets opened to the upside this morning confirming our latest domestic Buy signal. See section 3 below for more details.
2. ETFs in the Spotlight
In case you missed the announcement and description of this section, you can read it here again.
It features 10 broadly diversified ETFs from my HighVolume list as posted every Monday. Furthermore, they are screened for the lowest MaxDD% number meaning they have been showing better resistance to temporary sell offs than all others over the past year.
Here are the 10 candidates:
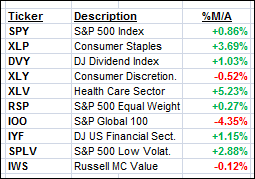
The above table simply demonstrates the magnitude with which some of the ETFs are fluctuating in regards to their positions above or below their respective individual trend lines (%M/A). A break below, represented by a negative number, shows weakness, while a break above, represented by a positive percentage, shows strength.
Year to date, here’s how the above candidates have fared so far:
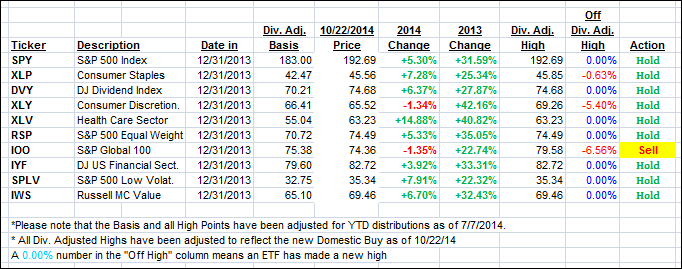
To be clear, the first table above shows the position of the various ETFs in relation to their respective long term trend lines (%M/A), while the second one tracks their trailing sell stops in the “Off High” column. The “Action” column will signal a “Sell” once the -7.5% point has been taken out in the “Off High” column.
3. Domestic Trend Tracking Indexes (TTIs)
Our Trend Tracking Indexes (TTIs) were again mixed today with the Domestic one gaining and the International one sinking deeper into bear market territory.
As posted yesterday, the markets opened to the upside this morning validating our new Domestic Buy signal effective today. I allocated a limited amount of assets and will only be adding more exposure once there is confirmation via continued upside momentum.
Last week’s sell-off, and the break below the long-term trend line, was fast and furious, and I believe we were about to go much lower if it hadn’t been for the 2 emergency assists I discussed in the commentary above.
Seeing such a fast rebound is not necessarily indicative of a new bullish trend, it could be part of a dead cat bounce or a blow-off. Whenever we get close to trend line crossings, the battle between bulls and bears gets fast and furious and volatility rises until a new trend, either up or down, is established.
So, a reversal back to the bearish side of the line would not surprise me. However, the risk with our new positions is fairly low since our Domestic TTI is hovering only +0.75% above its trend line meaning it will not take much downside action to get us back to the sidelines.
Actually, I have seen this movie before back in 2008. Take a look at the detail of what happened to the Domestic TTI:
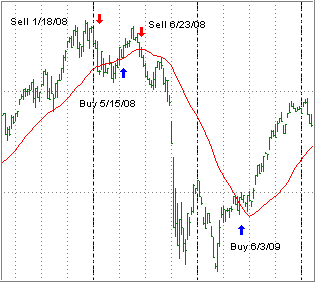
As you can seem, we had a Sell on 1/18/08, which was followed by a Buy on 5/15/08, which then was followed by a Sell on 6/23/08, which turned out to be the real thing.
Again, the goal here is to step aside and avoid the devastating market drops, which means that from time to time we will be exposed to whip-saw signals. It’s a small price to pay when you look at the chart and the consequences of not following our exit strategy.
Here’s how we ended up:
Domestic TTI: +0.75% (last close +1.26%)—Buy signal since 10/22/2014
International TTI: -3.45% (last close -2.97%)—Sell signal since 10/1/2014
Disclosure: I am obliged to inform you that I, as well as advisory clients of mine, own some of these listed ETFs. Furthermore, they do not represent a specific investment recommendation for you, they merely show which ETFs from the universe I track are falling within the guidelines specified.
Contact Ulli
Comments 1
Ulli, I greatly appreciate your frankness in reporting your 2008 whipsaw signals, the kind of thing you don’t see from every advisory service. Surely you were and are right in the long run. Mel