
1. Moving the Markets
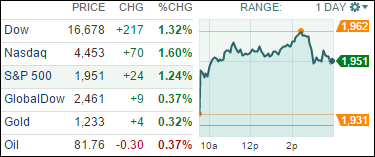
Equities got a major boost today from a bunch of strong earnings reports from companies such as Caterpillar (CAT) and General Motors (GM). The S&P 500 rose 1.24%, the Nasdaq gained 1.6% and the Dow ended up 1.32%.
Airline stocks fared well today as both Southwest (LUV) and United Continental (UAL) came out with earnings reports that topped analyst expectations. With 177 of the S&P 500 companies having posted third-quarter results, 69.5% have beaten expectations, better than the 67% beat rate over the past four quarters, and higher than the 20-year average of 63%.
As a counter to the upbeat earnings trend, Amazon (AMZN) had warned that it would lose bundles of cash in the third quarter, and it didn’t disappoint. The company said it had a net loss of $437 million for the quarter, compared with $41 million in the year-ago quarter. Shares of Amazon are down more than 23% on the year. Obviously the Fire phone was a flop; however, the company is bullish on their Kindle tablets. The company has a new line of tablets that have been better received, and it is looking to make a bigger splash with consumers by opening pop-up stores in San Francisco and Sacramento.
More good news came from overseas as analysts noted that the economy in Europe may be looking up. Europe benchmarks started the day in the red and closed higher. The DAX of Germany gained 1.2%. Major Asia indexes all lost, the Nikkei of Japan off 0.4%.
9 of our 10 ETFs in the Spotlight gained while one lost. Our latest Buy signal, effective yesterday, allowed us to participate in today’s rebound, which affected our Trend Tracking Indexes (TTIs) positively, as you can see in section 3 below.
2. ETFs in the Spotlight
In case you missed the announcement and description of this section, you can read it here again.
It features 10 broadly diversified ETFs from my HighVolume list as posted every Monday. Furthermore, they are screened for the lowest MaxDD% number meaning they have been showing better resistance to temporary sell offs than all others over the past year.
Here are the 10 candidates:
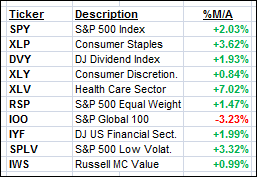
The above table simply demonstrates the magnitude with which some of the ETFs are fluctuating in regards to their positions above or below their respective individual trend lines (%M/A). A break below, represented by a negative number, shows weakness, while a break above, represented by a positive percentage, shows strength.
Year to date, here’s how the above candidates have fared so far:
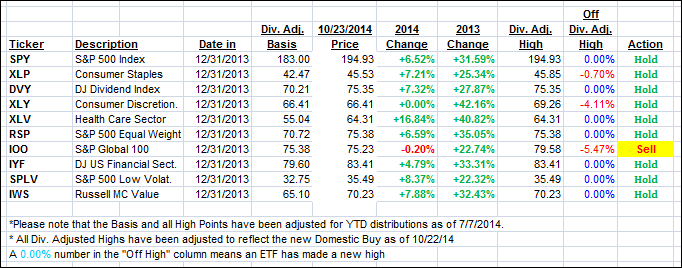
To be clear, the first table above shows the position of the various ETFs in relation to their respective long term trend lines (%M/A), while the second one tracks their trailing sell stops in the “Off High” column. The “Action” column will signal a “Sell” once the -7.5% point has been taken out in the “Off High” column.
3. Trend Tracking Indexes (TTIs)
Our Trend Tracking Indexes (TTIs) both improved with the International one, however, remaining on the bearish side of the trend line. We’ll have to wait and see for more upside confirmation to evaluate if this is a resumption of the bull market or merely a blow-off phase.
Here’s how we ended the day:
Domestic TTI: +1.35% (last close +0.75%)—Buy signal since 10/22/2014
International TTI: -2.63% (last close -3.45%)—Sell signal since 10/1/2014
Disclosure: I am obliged to inform you that I, as well as advisory clients of mine, own some of these listed ETFs. Furthermore, they do not represent a specific investment recommendation for you, they merely show which ETFs from the universe I track are falling within the guidelines specified.
Contact Ulli