
1. Moving the Markets
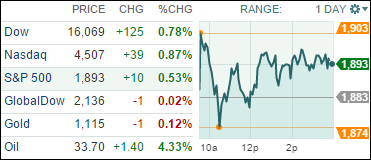
Stocks ended higher in choppy trading as oil prices rose for a third straight day and moved above $33 a barrel. The major indexes posted gains early as strong corporate earnings reports provided a boost which quickly evaporated before equities mounted another comeback.
In earnings news, Amazon (AMZN) missed Wall Street expectations, sending shares for a dive (-13%) in after-hours trading trading. The Seattle retailer reported $1 earnings per share on sales of $35.7 billion. The consensus earnings estimate has been $1.58 per share on revenue of $35.98 billion.
News in oil prices continued to grasp headline slots today, as the price of oil gained a whopping 4.33%. The bullish buy-in for oil futures came when swirling speculation that the Organization of the Petroleum Exporting Countries (OPEC) could slash production. Still, even if OPEC reduces production, macroeconomic concerns, such as the sluggish economy in China and the deteriorating situation in Brazil, are likely to continue to keep prices at low levels compared to recent yearly averages.
8 of our 10 ETFs in the Spotlight managed to close on the plus side with Consumer Staples (XLY) gaining +1.28%. The loser of the day was Healthcare (XLV), which got clobbered at the tune of -2.33%.
Let’s see if there is more fallout from the Amazon debacle tomorrow.
2. ETFs in the Spotlight
In case you missed the announcement and description of this section, you can read it here again.
It features 10 broadly diversified ETFs from my HighVolume list as posted every Monday. Furthermore, they are screened for the lowest MaxDD% number meaning they have been showing better resistance to temporary sell offs than all others over the past year.
Here are the 10 candidates:
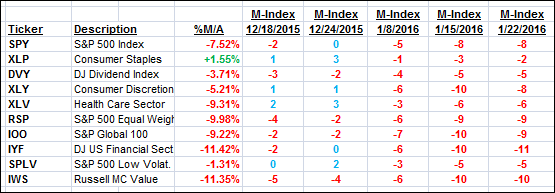
The above table simply demonstrates the magnitude with which some of the ETFs are fluctuating in regards to their positions above or below their respective individual trend lines (%M/A). A break below, represented by a negative number, shows weakness, while a break above, represented by a positive percentage, shows strength.
For hundreds of ETF/Mutual fund choices, be sure to reference Thursday’s StatSheet.
Year to date, here’s how the above candidates have fared so far:
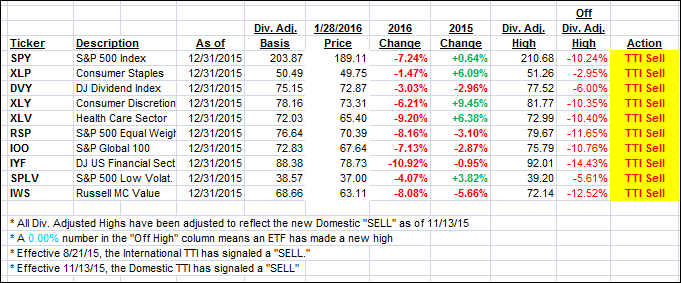
Again, the first table above shows the position of the various ETFs in relation to their respective long term trend lines (%M/A), while the second one tracks their trailing sell stops in the “Off High” column. The “Action” column will signal a “Sell” once the -7.5% point has been taken out in the “Off High” column.
3. Trend Tracking Indexes (TTIs)
Our Domestic Trend Tracking Index (TTI) showed only a small change with the major indexes not making much headway in either direction.
Here’s how we closed after another roller-coaster day:
Domestic TTI: -3.11% (last close -3.38%)—Sell signal effective 11/13/2015
International TTI: -10.69% (last close -10.67%)—Sell signal effective 8/21/2015
Disclosure: I am obliged to inform you that I, as well as advisory clients of mine, own some of these listed ETFs. Furthermore, they do not represent a specific investment recommendation for you, they merely show which ETFs from the universe I track are falling within the guidelines specified.
Contact Ulli