Equities Dip As Interest Rates Spike

Ulli Market Commentary Contact

thur-pic

[Chart courtesy of MarketWatch.com]
  1. Moving the Markets

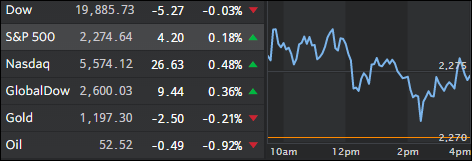
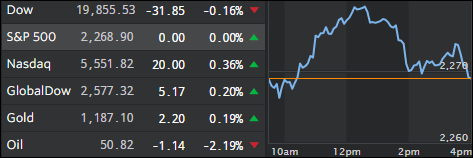
Finally, at least for one day, stocks and bonds were correlated again, something we have not seen in a while, and this may be a harbinger of things to come. Bond prices dropped as yields rose and stocks headed south early on, recovered mid-day, but the rally faded into the close leaving the S&P 500 with a -0.30% loss.

Earnings reports turned this session into a choppy and sloppy one with the Healthcare index showing strength while the real estate sector got clobbered and lost -2.5%, its worst decline in some 6 weeks.

After the close, Google rose 2% while heavyweight Amazon tumbled more than 6% after disappointing quarterly results. On deck tomorrow is the always highly anticipated jobs report, which can move markets in either direction.

Read More

Oil Leads Equities With Pump-And-Dump Theme

Ulli Market Commentary Contact

wed-pic

[Chart courtesy of MarketWatch.com]
  1. Moving the Markets

Equities started the day on a weak note when oil prices suddenly got pumped to touch the $50/barrel point before being dumped and ending the day down -1.62%. The S&P 500 followed suit but managed to limit its losses to a meager -0.17%.

Apple weighed on the overall market and closed down -2.25% as earnings in general did not bring any surprises, except for Boeing, which lifted the Dow by gaining +4.7%. Still, anxiety exists as earnings season continues and Wall Street looks towards Friday’s jobs report as well as the upcoming elections.

As has been the case lately, the worst performing sector was again Healthcare. Since that is a sector featured in my Spotlight ETFs below, you will have noticed that XLV has been in “Sell” mode for some time and has also broken below its respective trend line by -2.24%, which indicates that it is firmly entrenched in bear market territory. If you still own it, you haven’t been paying attention.

Read More

Earnings Data Wipe Out Yesterday’s Gains

Ulli Market Commentary Contact

tue-pic

[Chart courtesy of MarketWatch.com]
  1. Moving the Markets

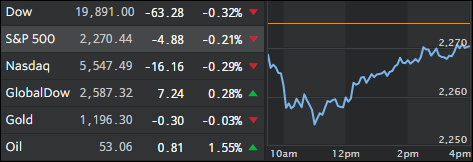
After a weak opening, the S&P 500 managed to kiss the unchanged line, but it was all downhill from there as stocks slipped from their 2-week highs made yesterday. Not helping matters was the dying Consumer Confidence bounce with the indicator sporting its biggest plunge in 11 months.

The US dollar continued its spike upwards supported in part by ever increasing interest rate hike odds, which now have topped 70%. While that may spell trouble for equities in the months ahead, a neutralizing factor could be a continued voracious appetite for stocks, a least for the time being.

Globally, economic weakness prevails as bellwether Caterpillar seems to confirm month after month. They have now failed for 46 consecutive months to post a retail sales increase. They again missed not only revenues but also slashed full year guidance. But then again, none of these realities matter to the markets as long as we can count on or hope for further Central Bank accommodative policies.

Read More

Earnings And Acquisitions Support The Indexes

Ulli Market Commentary Contact

mon-pic

[Chart courtesy of MarketWatch.com]
  1. Moving the Markets

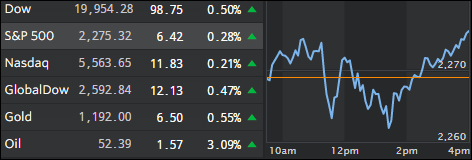
The S&P touched a two-week high as acquisitions and mergers confirmed to some that, despite hugely elevated market levels, untapped value still exists, although that is clearly in the eye of the beholder.

Expected annualized earnings are supposed to have been risen 1.1% last quarter, which is an improvement after four quarters of contraction. On one hand, this is a positive, however, on the other one also has to look at the fact that the major indexes hovering at extremely high levels, thanks to the Fed’s easy monetary policy, and are already evaluated way higher than underlying economic data would warrant. So, how much upside is left?

A potential fly in the ointment was the crash of China’s currency to all-time lows. When that has happened in the past, as in August 2015 and January 2016, stock markets have followed south and gone into meltdown mode. Will it happen again? Since no one has the answer, we’ll have to wait and see how that theme plays out and if there will be a fallout effect prior to the US election.

Read More

One Man’s Opinion: The Chart That Gives Citi “The Chills”

Ulli Market Review Contact

OneMan'sOpinionBy ZeroHedge

Two weeks ago, HSBC’s Murray Gunn warned of “ominous signs” exuding from the US equity markets. This weekend, Citi’s Tom Fitzpatrick confirmed the concerns exclaiming Travolta-esque “[we’ve] got chills [about the market], and they’re multiplying… and they’re losing control.”

While fully realizing that you can find a lot of similar overlays if you look hard enough…this one gives us “the chills”.

At a time when we have seen:

– Elevated concerns about Europe and its banks (possibly even creating some US/Europe conflict)

– The most polarizing US Presidential election in modern times

– Increased “taper talk” emanating from Japan and Europe and rising concerns about the efficacy of the Central bank policy around the World and the possibility it becomes unhinged.

– A 20 basis point move in US 10 year yields in 5 days;

– A 16% move in Oil in 7 days;

– A $90 move in Gold in 9 days;

– A chart on USDCNY that looks to be breaking to the topside and a huge GBPUSD move overnight in minutes

Is this the next shoe to drop?

Read More

ETFs On The Cutline – Updated Through 10/21/2016

Ulli ETFs on the Cutline Contact

Below please find the latest High Volume ETFs Cutline report, which shows how far above or below their respective long-term trend lines (39 week SMA) my currently tracked ETFs are positioned.

This report covers the HV ETF Master List from Thursday’s StatSheet and includes 366 High Volume ETFs ETFs, defined as those with an average daily volume of more than $5 million, of which currently 254 (last week 254) are hovering in bullish territory. The yellow line separates those ETFs that are positioned above their trend line from those that have dropped below it.

Take a look:

The HV ETF Master Cutline Report  

In case you are not familiar with some of the terminology used in the reports, please read the Glossary of Terms.

If you missed the original post about the Cutline approach, you can read it here.