Slipping And Sliding Towards The Elections; Moving Closer to A Domestic Sell Signal

Ulli Market Commentary Contact

tue-pic

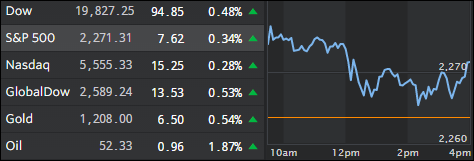
[Chart courtesy of MarketWatch.com]
  1. Moving the Markets

Things looked dicey for a while as the major indexes headed south driven by mixed economic data, election-related news and concern over prospects for higher interest rates.

The S&P 500 briefly touched the 2,099 level before bouncing higher as a modest afternoon rebound limited today’s losses. Today’s close was the lowest since July 7 as the widely assumed presidential race tightened and brought into question Clinton’s widely priced in win.

Adding more uncertainty is the current Fed meeting with its statement due on Wednesday. While it’s a forgone conclusion that there will be no rate hike this month, Wall Street will be looking for signs of a possible hike in December.

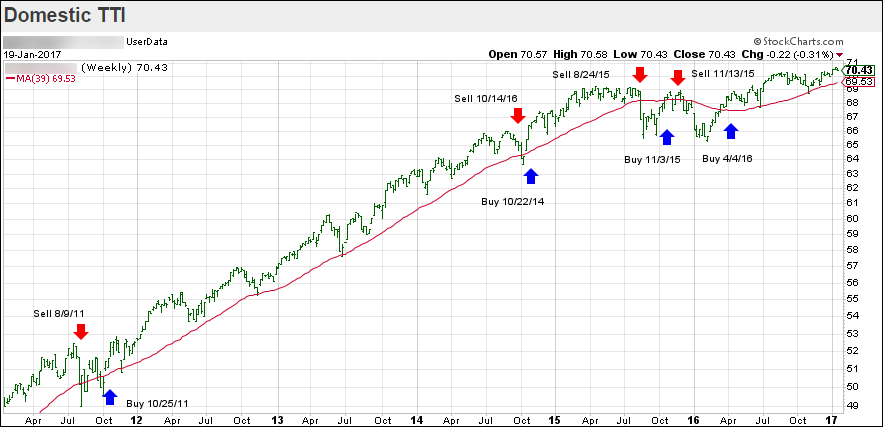
Our Trend Tracking Indexes (TTIs) continue to weaken with the Domestic TTI heading towards a possible trend line break into bear market territory. You can see the latest numbers in section 3 below. Be sure to tune in regularly so you don’t miss the point in time when the next “Sell” signal occurs.

Read More

Major Indexes Flat Among Election Doubts

Ulli Market Commentary Contact

mon-pic

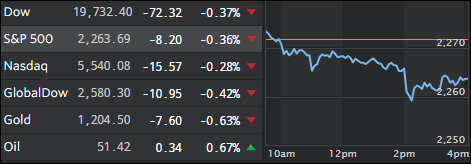
[Chart courtesy of MarketWatch.com]
  1. Moving the Markets

You could consider this a “non-day” as the major indexes vacillated predominantly above their unchanged lines but ended up as close to zero losses as you can get.

Fallout from Friday’s disclosure by the FBI about resuming the probe into Hillary’s use of an unauthorized email system shifted into high gear and caused more uncertainty about the Democratic’s alleged lead in the presidential elections.

Not helping matters was the Chicago PMI, a measure of economic activity, which hit its lowest reading in 5 months, the upcoming jobs report this Friday as well as the ongoing 2-day Fed meeting about possible rate hikes, the verdict of which will be read on Wednesday. Given that, I don’t see the markets going anywhere until clarification on these matters surfaces.

Read More

One Man’s Opinion: Recession Now… Or Depression Later

Ulli Market Review Contact

OneMan'sOpinionBy Peter Schiff

Currently economists and market watchers roughly fall into two camps: Those who believe that the Federal Reserve must begin raising interest rates now so that it will have enough rate cutting firepower to fight the next recession, and those who believe that raising rates now will simply precipitate an immediate recession and force the Fed into battle without the tools it has traditionally used to stimulate growth. Both camps are delusional, but for different reasons.

Most mainstream analysts believe that the current economy can survive with more normalized rates and that the Fed’s timidity is unwarranted. These people just haven’t been paying attention. The “recovery” of the past eight years hasn’t been just “helped along” by deeply negative real interest rates, it is a singular creation of those policies. Since June 2009, when the current recovery began, traditional economic metrics, such as GDP growth, productivity, business investment, labor force participation, and wage growth, have all been significantly below trend. The only strong positives have been gains in the stock, bond and real estate markets. We have had an “asset price” recovery rather than a bona fide economic recovery. This presents unique risks.

Asset price gains have been made possible in recent years because ultra-low rates have driven down the cost of borrowing, encouraged speculation, and pushed people into riskier assets. Donald Trump was right in the presidential debate when he noted that the whole economy is “a big fat ugly bubble.” Any rate hike could hit those markets hard across the financial spectrum and can tip the economy into contraction. Look what happened this January when the market had a chance to digest the first rate increase in 10 years. The 25 basis point increase in December 2015 led to one of the worst January’s in the history of the stock market. Since then, the Fed has held off from further tightening and the markets have treaded water. There is every reason to believe that the sell-off could resume if the Fed presses ahead.

Read More

ETFs On The Cutline – Updated Through 10/28/2016

Ulli ETFs on the Cutline Contact

Below please find the latest High Volume ETFs Cutline report, which shows how far above or below their respective long-term trend lines (39 week SMA) my currently tracked ETFs are positioned.

This report covers the HV ETF Master List from Thursday’s StatSheet and includes 366 High Volume ETFs ETFs, defined as those with an average daily volume of more than $5 million, of which currently 232 (last week 254) are hovering in bullish territory. The yellow line separates those ETFs that are positioned above their trend line from those that have dropped below it.

Take a look:

The HV ETF Master Cutline Report        

In case you are not familiar with some of the terminology used in the reports, please read the Glossary of Terms.

If you missed the original post about the Cutline approach, you can read it here.

ETF Tracker Newsletter For October 28, 2016

Ulli ETF Tracker Contact

ETF Tracker StatSheet

————————————————————-

https://theetfbully.com/2016/10/weekly-statsheet-for-the-etf-tracker-newsletter-updated-through-10272016/

————————————————————

Market Commentary

FBI Announcement Kills Market Rebound

fri-pic

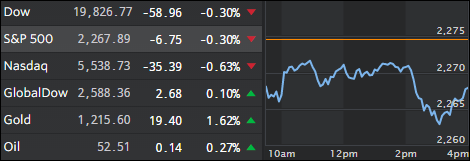
[Chart courtesy of MarketWatch.com]
  1. Moving the Markets

The surprise came out of left field, as the markets were enjoying a modest rebound, in form of an FBI announcement that it will investigate new emails related to the Democratic nominee Hillary Clinton. That’s all it took and the S&P dropped about 1% before crawling back and limiting its losses for the day to -0.31% and -0.7% for the week.

FBI Director James Comey said in a letter to congressional Republicans that more emails had surfaced that “appear to be pertinent to its investigation” causing momentary panic that the outcome of the elections might be affected.

The latest GDP data showed a growth of 2.9% in the third quarter stoking fears that the case for an interest hike is still on the table. However, with the next Fed meeting being a few days before November 8, a potential hike will very likely be postponed until the December gathering.

Still, I expect volatility to ramp up as we move closer to Election Day. I also would not be surprised to see our Domestic Trend Tracking Index (see section 3 below) to break below its trend line and signal a return to bear market territory. We have now broken below the +1% level and things could accelerate from here. Stay tuned!

Read More

Weekly StatSheet For The ETF Tracker Newsletter – Updated Through 10/27/2016

Ulli ETF StatSheet Contact

ETF Data updated through Thursday, October 27, 2016

TOC082516

Methodology/Use of this StatSheet:

  1. From the universe of over 1,800 ETFs, I have selected only those with a trading volume of over $5 million per day (HV ETFs), so that liquidity and a small bid/ask spread are assured.
  2. Trend Tracking Indexes (TTIs)

Buy or Sell decisions for Domestic and International ETFs (section 1 and 2), are made based on the respective TTI and its position either above or below its long-term M/A (Moving Average). A crossing of the trend line from below accompanied by some staying power above constitutes a “Buy” signal. Conversely, a clear break below the line constitutes a “Sell” signal. Additionally, I use a 7.5% trailing stop loss on all positions in these categories to control downside risk.

  1. All other investment arenas do not have a TTI and should be traded based on the position of the individual ETF relative to its own respective trend line (%M/A). That’s why those signals are referred to as a “Selective Buy.” In other words, if an ETF crosses its own trendline to the upside, a “Buy” signal is generated. Since these areas tend to be more volatile, I recommend a wider trailing sell stop of 7.5% -10% depending on your risk tolerance.

If you are unfamiliar with some of the terminology, please see Glossary of Terms and new subscriber information in section 9.


  1. DOMESTIC EQUITY ETFs: BUY — since 4/4/2016

tti

Our main directional indicator, the Domestic Trend Tracking Index (TTI-green line in the above chart) remains above its long-term trend line (red) by +0.94% after having generated a new Domestic Buy signal effective 4/4/2016 as posted.

Read More