
- Moving the Markets
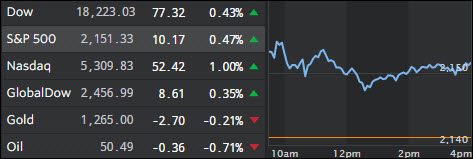
The S&P touched a two-week high as acquisitions and mergers confirmed to some that, despite hugely elevated market levels, untapped value still exists, although that is clearly in the eye of the beholder.
Expected annualized earnings are supposed to have been risen 1.1% last quarter, which is an improvement after four quarters of contraction. On one hand, this is a positive, however, on the other one also has to look at the fact that the major indexes hovering at extremely high levels, thanks to the Fed’s easy monetary policy, and are already evaluated way higher than underlying economic data would warrant. So, how much upside is left?
A potential fly in the ointment was the crash of China’s currency to all-time lows. When that has happened in the past, as in August 2015 and January 2016, stock markets have followed south and gone into meltdown mode. Will it happen again? Since no one has the answer, we’ll have to wait and see how that theme plays out and if there will be a fallout effect prior to the US election.
- ETFs in the Spotlight
In case you missed the announcement and description of this section, you can read it here again.
It features 10 broadly diversified ETFs from my HighVolume list as posted every Monday. Furthermore, they are screened for the lowest MaxDD% number meaning they have been showing better resistance to temporary sell offs than all others over the past year.
Here are the 10 candidates:
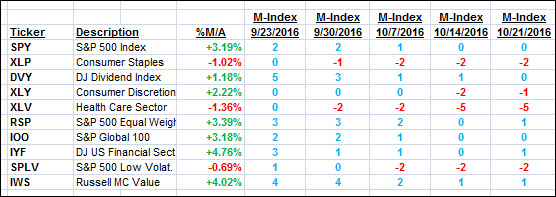
The above table simply demonstrates the magnitude with which some of the ETFs are fluctuating in regards to their positions above or below their respective individual trend lines (%M/A). A break below, represented by a negative number, shows weakness, while a break above, represented by a positive percentage, shows strength.
For hundreds of ETF choices, be sure to reference Thursday’s StatSheet.
Year to date, here’s how the above candidates have fared so far:
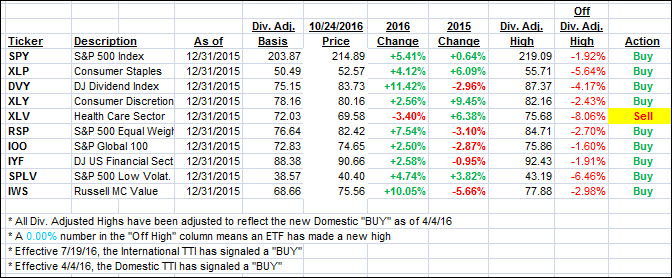
Again, the first table above shows the position of the various ETFs in relation to their respective long term trend lines (%M/A), while the second one tracks their trailing sell stops in the “Off High” column. The “Action” column will signal a “Sell” once the -7.5% point has been taken out in the “Off High” column.
- Trend Tracking Indexes (TTIs)
Both of our Trend Tracking Indexes (TTIs) improved as the major indexes inched higher with the S&P 500 gaining +0.47%.
Here’s how we closed 10/24/2016:
Domestic TTI: +1.69% (last close +1.45%)—Buy signal effective 4/4/2016
International TTI: +3.43% (last close +3.24%)—Buy signal effective 7/19/2016
Disclosure: I am obliged to inform you that I, as well as my advisory clients, own some of the ETFs listed in the above table. Furthermore, they do not represent a specific investment recommendation for you, they merely show which ETFs from the universe I track are falling within the guidelines specified.
Contact Ulli