
- Moving the Markets
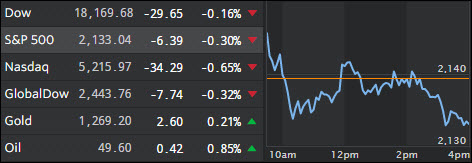
Finally, at least for one day, stocks and bonds were correlated again, something we have not seen in a while, and this may be a harbinger of things to come. Bond prices dropped as yields rose and stocks headed south early on, recovered mid-day, but the rally faded into the close leaving the S&P 500 with a -0.30% loss.
Earnings reports turned this session into a choppy and sloppy one with the Healthcare index showing strength while the real estate sector got clobbered and lost -2.5%, its worst decline in some 6 weeks.
After the close, Google rose 2% while heavyweight Amazon tumbled more than 6% after disappointing quarterly results. On deck tomorrow is the always highly anticipated jobs report, which can move markets in either direction.
- ETFs in the Spotlight
In case you missed the announcement and description of this section, you can read it here again.
It features 10 broadly diversified ETFs from my HighVolume list as posted every Monday. Furthermore, they are screened for the lowest MaxDD% number meaning they have been showing better resistance to temporary sell offs than all others over the past year.
Here are the 10 candidates:
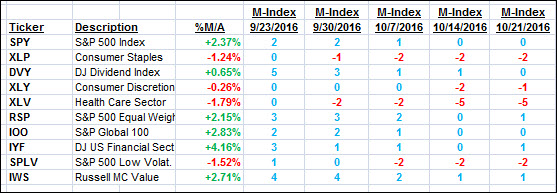
The above table simply demonstrates the magnitude with which some of the ETFs are fluctuating in regards to their positions above or below their respective individual trend lines (%M/A). A break below, represented by a negative number, shows weakness, while a break above, represented by a positive percentage, shows strength.
For hundreds of ETF choices, be sure to reference Thursday’s StatSheet.
Year to date, here’s how the above candidates have fared so far:
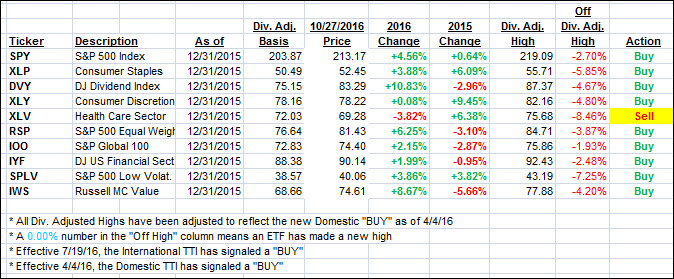
Again, the first table above shows the position of the various ETFs in relation to their respective long term trend lines (%M/A), while the second one tracks their trailing sell stops in the “Off High” column. The “Action” column will signal a “Sell” once the -7.5% point has been taken out in the “Off High” column.
- Trend Tracking Indexes (TTIs)
Both of our Trend Tracking Indexes (TTIs) slipped for the 3rd day as interest rates rose, which pulled the major indexes lower.
Here’s how we closed 10/27/2016:
Domestic TTI: +0.94% (last close +1.18%)—Buy signal effective 4/4/2016
International TTI: +2.66% (last close +2.95%)—Buy signal effective 7/19/2016
Disclosure: I am obliged to inform you that I, as well as my advisory clients, own some of the ETFs listed in the above table. Furthermore, they do not represent a specific investment recommendation for you, they merely show which ETFs from the universe I track are falling within the guidelines specified.
Contact Ulli