
- Moving the Markets
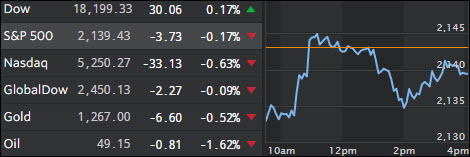
Equities started the day on a weak note when oil prices suddenly got pumped to touch the $50/barrel point before being dumped and ending the day down -1.62%. The S&P 500 followed suit but managed to limit its losses to a meager -0.17%.
Apple weighed on the overall market and closed down -2.25% as earnings in general did not bring any surprises, except for Boeing, which lifted the Dow by gaining +4.7%. Still, anxiety exists as earnings season continues and Wall Street looks towards Friday’s jobs report as well as the upcoming elections.
As has been the case lately, the worst performing sector was again Healthcare. Since that is a sector featured in my Spotlight ETFs below, you will have noticed that XLV has been in “Sell” mode for some time and has also broken below its respective trend line by -2.24%, which indicates that it is firmly entrenched in bear market territory. If you still own it, you haven’t been paying attention.
- ETFs in the Spotlight
In case you missed the announcement and description of this section, you can read it here again.
It features 10 broadly diversified ETFs from my HighVolume list as posted every Monday. Furthermore, they are screened for the lowest MaxDD% number meaning they have been showing better resistance to temporary sell offs than all others over the past year.
Here are the 10 candidates:
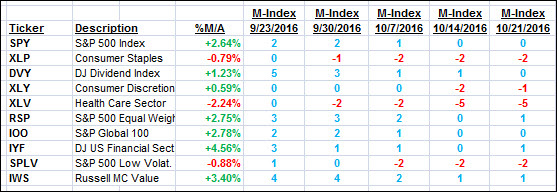
The above table simply demonstrates the magnitude with which some of the ETFs are fluctuating in regards to their positions above or below their respective individual trend lines (%M/A). A break below, represented by a negative number, shows weakness, while a break above, represented by a positive percentage, shows strength.
For hundreds of ETF choices, be sure to reference Thursday’s StatSheet.
Year to date, here’s how the above candidates have fared so far:
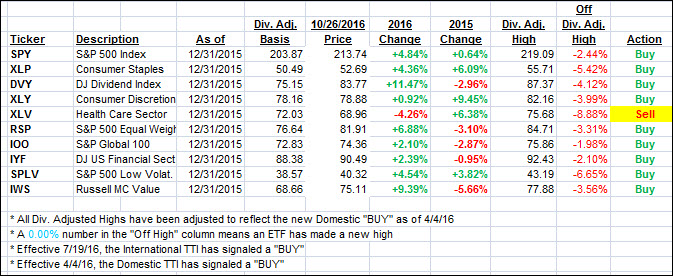
Again, the first table above shows the position of the various ETFs in relation to their respective long term trend lines (%M/A), while the second one tracks their trailing sell stops in the “Off High” column. The “Action” column will signal a “Sell” once the -7.5% point has been taken out in the “Off High” column.
- Trend Tracking Indexes (TTIs)
Both of our Trend Tracking Indexes (TTIs) headed south again as an early drop was minimized with the major indexes staging a recovery.
Here’s how we closed 10/26/2016:
Domestic TTI: +1.18% (last close +1.36%)—Buy signal effective 4/4/2016
International TTI: +2.95% (last close +3.20%)—Buy signal effective 7/19/2016
Disclosure: I am obliged to inform you that I, as well as my advisory clients, own some of the ETFs listed in the above table. Furthermore, they do not represent a specific investment recommendation for you, they merely show which ETFs from the universe I track are falling within the guidelines specified.
Contact Ulli