ETF Tracker Newsletter For October 21, 2016

Ulli ETF Tracker Contact

ETF Tracker StatSheet

————————————————————-

https://theetfbully.com/2016/10/weekly-statsheet-for-the-etf-tracker-newsletter-updated-through-10202016/

————————————————————

Market Commentary

fri-pic

[Chart courtesy of MarketWatch.com]
  1. Moving the Markets

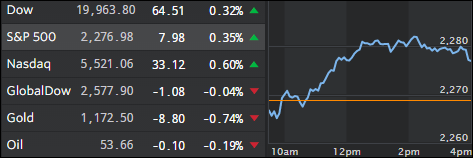
The major indexes ended up just about unchanged with the exception of the Nasdaq which eked out at +0.30% gain. Energy and Healthcare fell while Microsoft and McDonald’s kept the markets propped up. Still, questions keep coming up as to whether the lack of pace with regards to economic activity can justify the current lofty equity levels.

As I have repeatedly posted, macro data have been on a downward slide for a couple of months now, and it’s just a matter of time when the major indexes have to adjust to that reality. Of course, with Central Banks manipulating markets higher, there is no way of knowing when that moment of truth will arrive. Here’s the visual, thanks to ZH, in regards to the divergence between the S&P 500 and current US Macro data:

Read More

Weekly StatSheet For The ETF Tracker Newsletter – Updated Through 10/20/2016

Ulli ETF StatSheet Contact

ETF Data updated through Thursday, October 20, 2016

TOC082516

Methodology/Use of this StatSheet:

  1. From the universe of over 1,800 ETFs, I have selected only those with a trading volume of over $5 million per day (HV ETFs), so that liquidity and a small bid/ask spread are assured.
  2. Trend Tracking Indexes (TTIs)

Buy or Sell decisions for Domestic and International ETFs (section 1 and 2), are made based on the respective TTI and its position either above or below its long-term M/A (Moving Average). A crossing of the trend line from below accompanied by some staying power above constitutes a “Buy” signal. Conversely, a clear break below the line constitutes a “Sell” signal. Additionally, I use a 7.5% trailing stop loss on all positions in these categories to control downside risk.

  1. All other investment arenas do not have a TTI and should be traded based on the position of the individual ETF relative to its own respective trend line (%M/A). That’s why those signals are referred to as a “Selective Buy.” In other words, if an ETF crosses its own trendline to the upside, a “Buy” signal is generated. Since these areas tend to be more volatile, I recommend a wider trailing sell stop of 7.5% -10% depending on your risk tolerance.

If you are unfamiliar with some of the terminology, please see Glossary of Terms and new subscriber information in section 9.


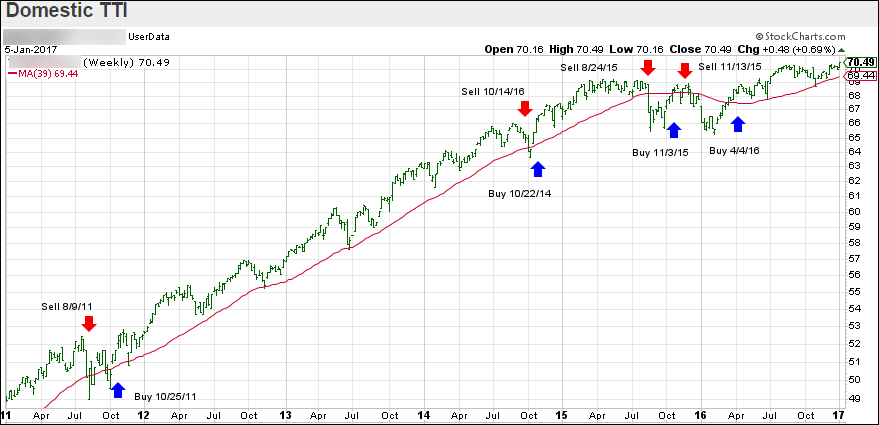
  1. DOMESTIC EQUITY ETFs: BUY — since 4/4/2016

tti

Our main directional indicator, the Domestic Trend Tracking Index (TTI-green line in the above chart) remains above its long-term trend line (red) by +1.47% after having generated a new Domestic Buy signal effective 4/4/2016 as posted.

Read More

Volatility Increases As Crude Oil Crumbles

Ulli Market Commentary Contact

thur-pic

[Chart courtesy of MarketWatch.com]
  1. Moving the Markets

Markets were a little chaotic early in the session as the major indexes had rallied and then collapsed below the trend line very quickly as the chart above shows. Slowly but surely, we recovered, touched the unchanged line a few times but ended up closing slightly below it.

Economic data points continued their downward path with jobless claims jumping the most in over 5 months, existing home sales growth stalling (yet prices kept rising) while consumer confidence slipped to the lowest since last year. In other words, the economy is going nowhere fast.

Over in Europe, the ECB disappointed by not considering a QE extension beyond March and Draghi announcing that “extraordinary policy support won’t exist forever.” Of course, things in Europe work the same as here in the US and bad market news ended up being good news, as an early sell off was followed by a broad recovery with the German DAX closing up +0.52%. Go figure…

Read More

Earnings And Oil Assist The Markets

Ulli Market Commentary Contact

wed-pic

[Chart courtesy of MarketWatch.com]

1. Moving the Markets

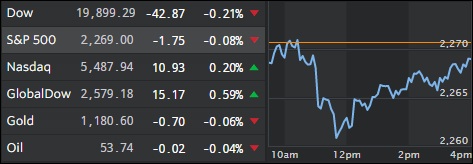
The major indexes rallied moderately supported by better-than expected quarterly results from Morgan Stanley along with oil prices, which gained over 2% and are nearing their 15-month high.

And again, data points confirmed sluggishness in the economy as shown by weak housing data and a disappointing outlook in the tech area, which kept the Nasdaq hovering around the unchanged line all day.

Of course, all eyes are on tonight’s final Presidential debate, which contributed to the markets being in “subdued” mode. With the daily economic data flow coming in mostly to the downside, it clearly shows that the level of the S&P 500 does not represent the true economy, but GDP numbers do. ZH posted this spot-on chart for reference:

Read More

Netflix Saves The Day

Ulli Market Commentary Contact

tue-pic

[Chart courtesy of MarketWatch.com]

1. Moving the Markets

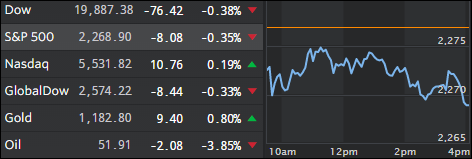
Of course, it’s only the beginning of the third quarter earnings season but talk of growth expectations in the +0.2% area was the theme of the day. It also means that the quarter has to stay on this track to match the fourth-quarter of 2014 in which both earnings and revenues headed north. If that happens, it would bring to an end a four quarter string of declines. Netflix was the star of the day with a gain of 19%.

Offsetting corporate news was the reality we all have to live with and that is higher inflation. US consumer prices showed their biggest gain in five months with +0.3%. As you know, the Fed has a 2% inflation target and uses an inflation measure, which is currently at 1.7%. As we get closer to this target, the odds increase that a rate hike may no longer be avoided. After all, you can’t simply turn inflation on or off with a switch. Once it gains momentum it’s very difficult to reverse.

For the day, the three major indexes closed up, but it remains to be seen if the balance of earnings season can support current expectations.

Read More

Fed Speak Keeps Markets On Edge

Ulli Market Commentary Contact

mon-pic

[Chart courtesy of MarketWatch.com]

1. Moving the Markets

Despite BofA reporting its first profit increase in three quarters, it wasn’t enough to keep the markets above the unchanged line. Offsetting the positive tone were some weak economic data points in form of industrial production contracting for the 13th straight month, its longest non-recessionary streak ever. Adding to this misery was a big miss by the Empire Fed with the index sliding to 5 months lows as new orders continued to skid.

Against this backdrop, conflicting statements in regards to the timing of a possible rate hike has kept everybody on edge. There was Fed Vice Chairman Fischer’s warning that “economic stability” could be threatened by low interest rates yet he mentioned that “it was not that simple” for the Fed to raise rates. Of course it’s not that simple if you are beholden to Wall Street and are trying to avoid a correction to fair market value at all costs.

So, it appears that, all of a sudden, low interest rates are no longer a good thing and neither are higher ones. If you find that confusing, you are not the only one. I don’t think there is any better way to talk out of both sides of your mouth, but we’ll have to wait and see if we will hear more non-committal words of Fed wisdom in the future.

Read More