ETF Tracker Newsletter For July 24, 2020

Ulli ETF Tracker Contact

ETF Tracker StatSheet          

You can view the latest version here.

DIGGING A HOLE AND FAILING TO CLIMB OUT OF IT
[Chart courtesy of MarketWatch.com]

  1. Moving the markets

Negative sentiment was clearly present in the futures markets with US indexes falling and Chinese stocks tumbling on increased tensions between the US and China. The tit-for-tat on forcing closures of each other’s consulates continued unabated.

Global stocks took a hit, while domestically Intel shares slumped (some -15%) on a report that a new chip technology would be delayed, causing the entire tech sector to start the regular session in the red.

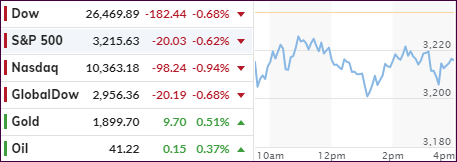
Even though the Nasdaq came off its worst level of the day, it ended up with back-to-back declines.

Not helping matters was the lack of progress for another fiscal stimulus bill in Washington, while rising coronavirus counts in 40 states were and continues to limit business and consumer activity and creating more doubt about the dream of a V-shape recovery.

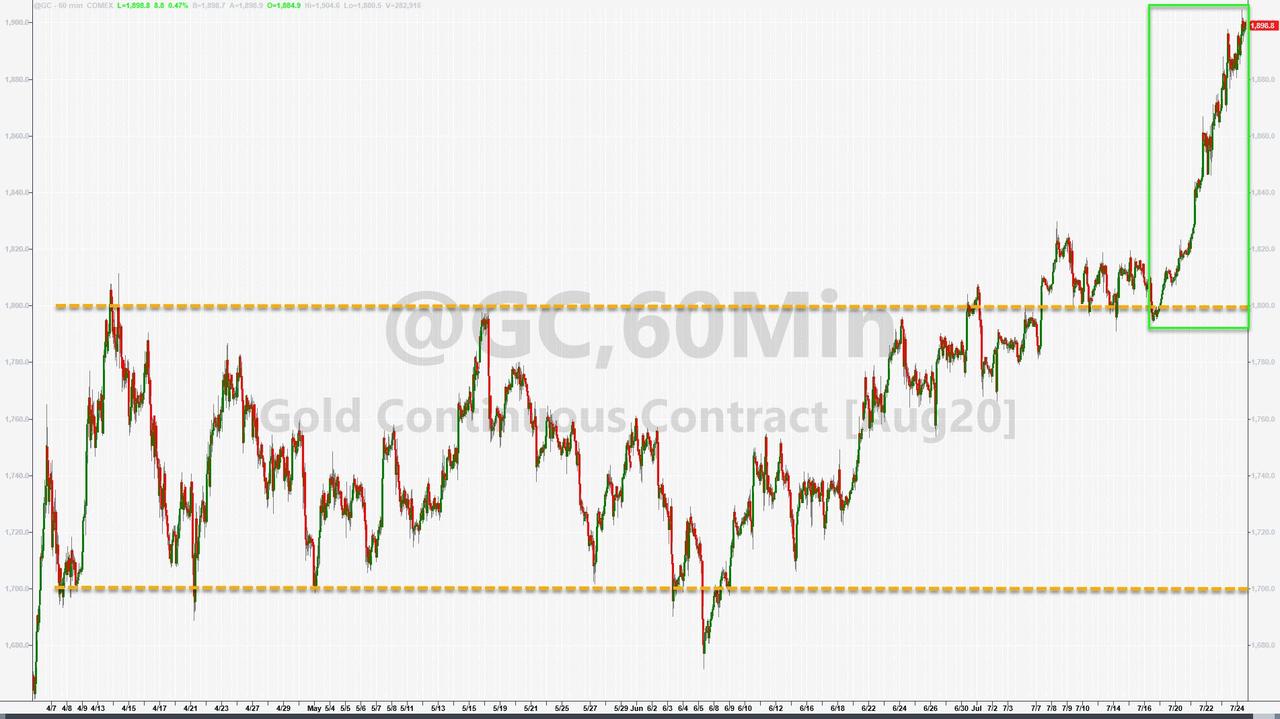
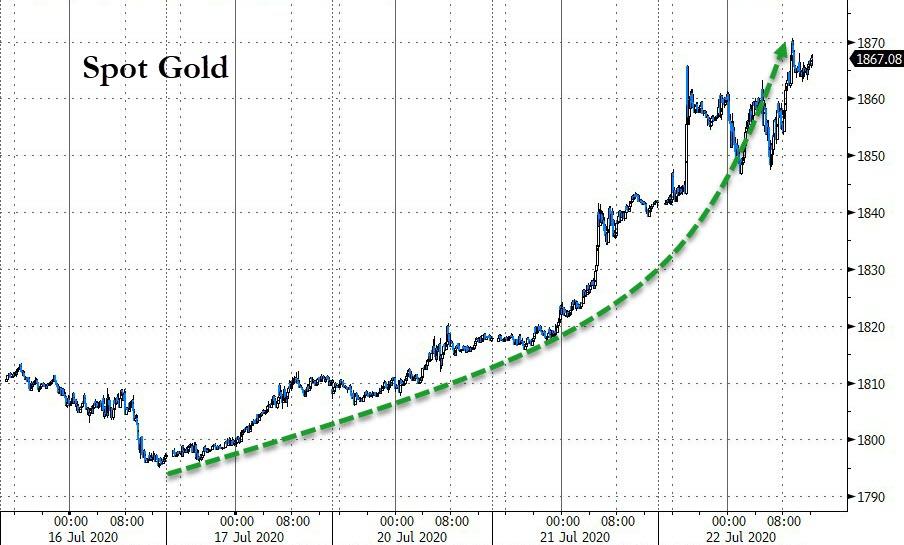
Gold was the standout performer again, offsetting some of the Nasdaq losses. As I pointed out before, I see a lot of upside potential for gold in the future given the reckless and unprecedented money printing efforts by the Fed.

A great explanation about the importance of gold in today’s environment came from Johnny Bravo in an interview with SchiffGold:

“The reason that governments don’t like gold is probably for the same reason that kids don’t like chaperones at the senior prom. Because the chaperones are there to keep the kids in line and prevent them from doing things they really shouldn’t be doing. And that’s really what gold does. It’s kind of like a chaperone for government politicians because it keeps them honest. Because if you have real money, and government wants to spend money on programs, it needs to collect that money in taxes. And that generally puts a brake on a lot of programs because the public doesn’t want to pay.

…

Gold stands in the way, because you can print paper out of thin air. But gold can’t be printed into existence; it needs to be mined. And if we’re on a gold standard, and gold is money, then the government needs real money. And since it doesn’t have the ability to make it, it has to collect it in taxes before it can spend it back into circulation.”

Next week, the markets will be dealing with the looming effects of the expiration of the eviction moratorium.

The Federal Housing Administration (FHA) was able to stop evictions of renters during the coronavirus pandemic. The Coronavirus Aid, Relief, and Economic Security Act (CARES) also made it unlawful for landlords to evict tenants in federally subsidized or federally backed housing. However, those protections are set to expire today (Friday, July 24).

Of course, it’s widely expected that the government will ride to rescue via an extension, but then we also have this:

The end of eviction protection comes as households are being hit with a fiscal cliff. The $600 in weekly federal unemployment assistance for tens of millions of folks is set to expire next week. We’ve called it an “income cliff,” as it would mean consumption would crater, and the recovery would quickly reverse. 

These are a lot of issues for the markets to deal with, although they are all known. This week’s pullback was relatively mild with the S&P 500 given back about 0.5%, while none of our trailing sell stops were in danger of being triggered.

Read More
Weekly StatSheet For The ETF Tracker Newsletter – Updated Through 07/23/2020

Ulli ETF StatSheet Contact

ETF Data updated through Thursday, July 23, 2020

Methodology/Use of this StatSheet:

1. From the universe of over 1,800 ETFs, I have selected only those with a trading volume of over $5 million per day (HV ETFs), so that liquidity and a small bid/ask spread are assured.

2. Trend Tracking Indexes (TTIs)

Buy or Sell decisions for Domestic and International ETFs (section 1 and 2), are made based on the respective TTI and its position either above or below its long-term M/A (Moving Average). A crossing of the trend line from below accompanied by some staying power above constitutes a “Buy” signal. Conversely, a clear break below the line constitutes a “Sell” signal. Additionally, I use a 7.5% trailing stop loss on all positions in these categories to control downside risk.

3. All other investment arenas do not have a TTI and should be traded based on  the position of the individual ETF relative to its own respective trend line (%M/A). That’s why those signals are referred to as a “Selective Buy.” In other words, if an ETF crosses its own trendline to the upside, a “Buy” signal is generated. Since these areas tend to be more volatile, I recommend a wider trailing sell stop of 7.5% -10% depending on your risk tolerance.

If you are unfamiliar with some of the terminology, please see Glossary of Terms and new subscriber information in section 9.     

1. DOMESTIC EQUITY ETFs: BUY — since 07/22/2020

Click on chart to enlarge

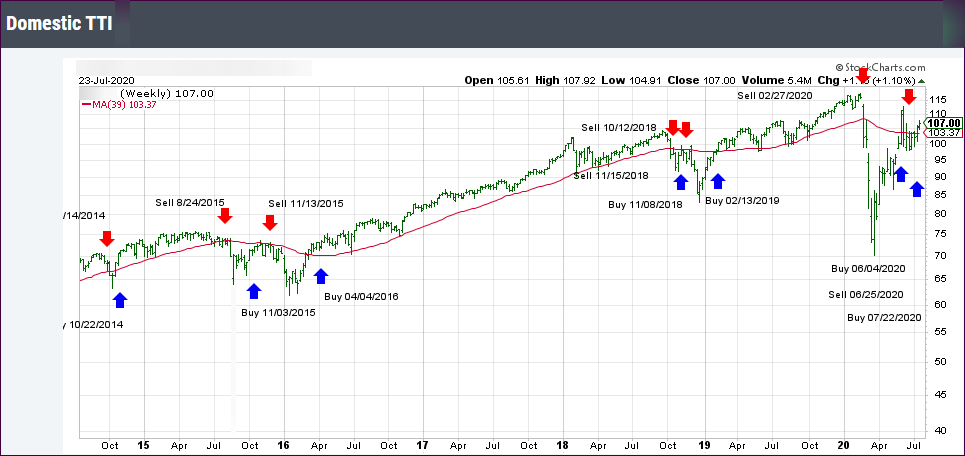
Our main directional indicator, the Domestic Trend Tracking Index (TTI-green line in the above chart) has now rallied above its long-term trend line (red) by +3.50% and is in “BUY” mode as posted.

Read More

Equities Stumble In Search For Direction—Gold Shines

Ulli Market Commentary Contact

[Chart courtesy of MarketWatch.com]

  1. Moving the markets

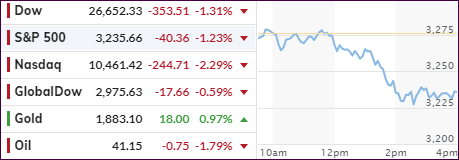
Early weakness in equities prevailed throughout the session, but downward momentum accelerated leaving the major indexes in the red with the Nasdaq taking the brunt of the beating.

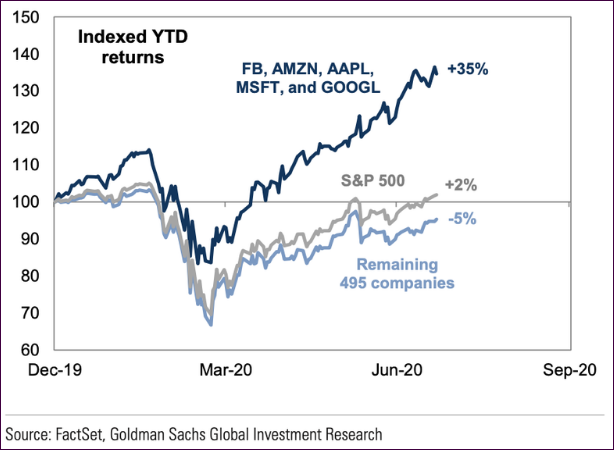
As we all know, the tech sector has been on a tear, so corrections are to be expected. Look at this chart below showing the dominance of tech within the S&P 500 composition:

What this demonstrates is downright mindboggling: The five largest stocks have returned 35% YTD; the other 495 stocks have declined by 5%. And as a composite, the S&P has gained +2% YTD!

Late in the session, the slide stopped, in part due to some Fed intervention, as ZH pointed out tongue-in-cheek:

Well, it took it’s sweet time, but at exactly 2:30pm the Fed fired a warning shot at all the racist criminals known as “sellers” when it announced that it had “broadened the set of firms eligible to transact with and provide services in three emergency lending facilities.”

… apparently the Fed decided that the only reason there is not even more demand, is because the program is too… limiting, and so it decided to expand the list of counterparties. The signal was clear: any more selling and the Fed starts buying stocks.

Today’s timeline of events was as follows:

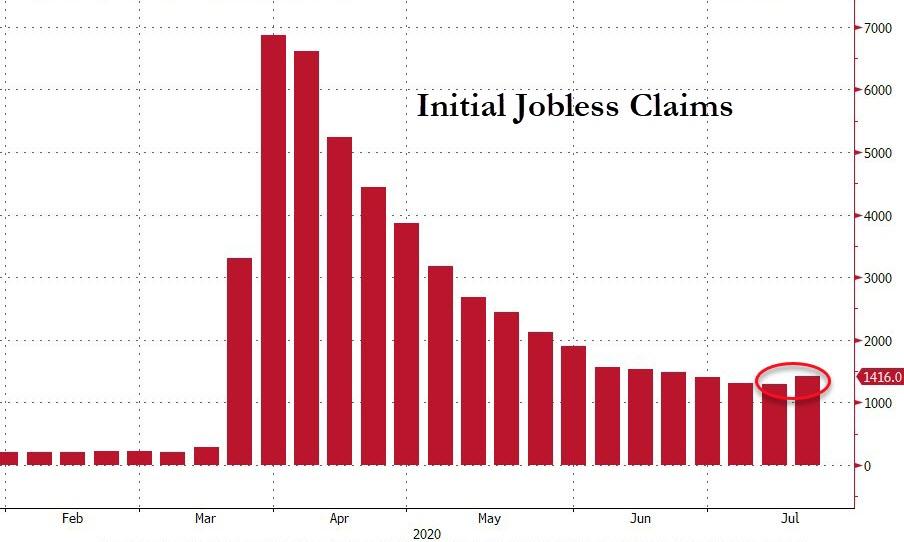
0830ET *FIRST RISE IN INITIAL JOBLESS CLAIMS SINCE MARCH

1035ET *FLORIDA POSTS RECORD 173 DAILY VIRUS DEATHS AMONG RESIDENTS

1320ET *HOUSE ANTITRUST PANEL TO EYE AMAZON, APPLE, FACEBOOK, GOOGLE

1335ET *APPLE FACING MULTI-STATE CONSUMER PROTECTION PROBE

But then, in a panicked moment from The Fed as losses accelerated, the collapse stalled as this hit…

1430ET *FED BROADENS FIRMS IT WILL TRANSACT WITH ON THREE LOAN PROGRAMS

We will find out tomorrow if the Fed’s signal was received and accepted, or if the bears continue to have another day in the limelight.

Read More

Aimless Meandering—Gold Reigns

Ulli Market Commentary Contact

[Chart courtesy of MarketWatch.com]

  1. Moving the markets

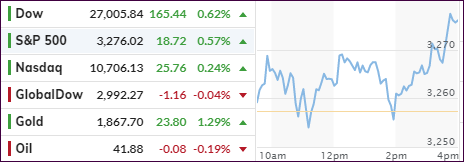
For most of the session, the markets engaged in directionless wandering but, as we’ve seen many times in the past, an afternoon ramp pushed the 3 major indexes solidly in the green, while pulling the lagging Nasdaq along for the ride.

Two concerns kept the indexes stuck in a range, namely fears that the pandemic is worsening and the rapidly deteriorating US/China relations. Regarding the latter, the US instructed China to close its consulate in Houston provoking consequences that are unknown at this point.

In the end, equities shook off all concerns, and we rallied into the close leaving all issues in the rear-view mirror—for the time being.

In terms of earnings, MarketWatch added:

Thus far, quarterly results have been better than feared. Of the 58 companies that have reported results thus far, 77.6% have reported above analyst expectations, compared with the average of 65% who reported above consensus estimates in prior quarters, according to data from Refinitiv, based on data going back to 1994. A little over 22% have reported results that fall below expectations, versus an average of 21% missing, the data show.

As announced yesterday, both of our Trend Tracking Indexes (TTIs) signaled a new “Buy.” We received confirmation this morning when the markets held steady and did not sell off. Our Domestic TTI took another jump today validating the current bullish theme. See section 3 for more details.   

Also, GLD, which we hold, turned out to be the winner of the day again with another solid showing of +1.52%. Thanks to the Fed, and its reckless money printing efforts, the precious metal has far more upside potential than what we have seen to this point.

Read More

Equities Gain But Gold Soars—Buy Signals Triggered

Ulli Market Commentary Contact

[Chart courtesy of MarketWatch.com]

  1. Moving the markets

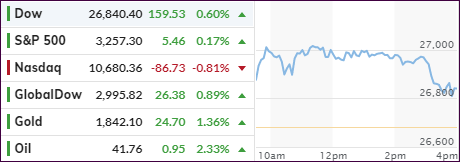
While equities and gold usually diverge, today both gained, but the precious metal put on a superior performance with GLD adding +1.22% vs. the S&P 500s meager +0.17%. After the Nasdaq’s outstanding outing yesterday, the tech sector was due for a time out, and the index surrendered -0.81%.

Market sentiment was cheerful after the EU reached a historic pandemic bailout deal, as ZH called it, with a massive $860 billion recovery plan for their coronavirus-throttled economies. The tug-of-war to come to a solution spanned some 5 days and included a variety of turbulent and seemingly endless negotiating sessions.

Despite early sharp advances, the gains ended up being muted with the S&P attempting to break out of a 6-week trading range.

“The S&P 500 is breaking out of trading range,” said Crista Huff, founder of hedge fund Freedom Investment Partners, told MarketWatch. “We are beginning a bull run.” But “Clearly we have some massive problems in the economy and there are so many people that are unemployed and 10 or 20 million aren’t going to have an easy time finding a new job,” she added.

Still, some sectors performed well giving our Trend Tracking Indexes (TTIs) the boost they needed to validate new Buy signals. Please see section 3 for details.

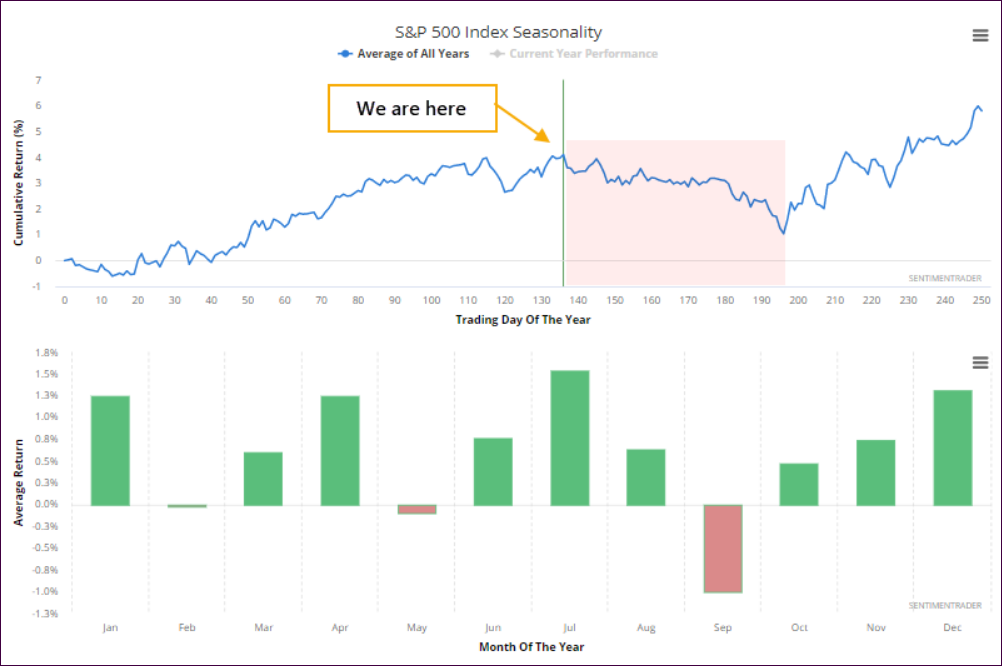
Analyst Lance Roberts shows the seasonal effects on the S&P 500 as an average of all years in this chart:

As you can see, we are still in the seasonally strong part of the year, and the obvious question to me is this one: “Will a potential correction in September be strong enough to trigger our trailing sell stops?”

Since no one has the answer, we will continue to follow the major trends and step aside should they get interrupted.

Read More

The Nasdaq Rules

Ulli Market Commentary Contact

[Chart courtesy of MarketWatch.com]

  1. Moving the markets

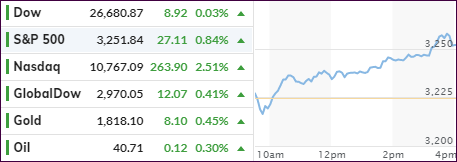
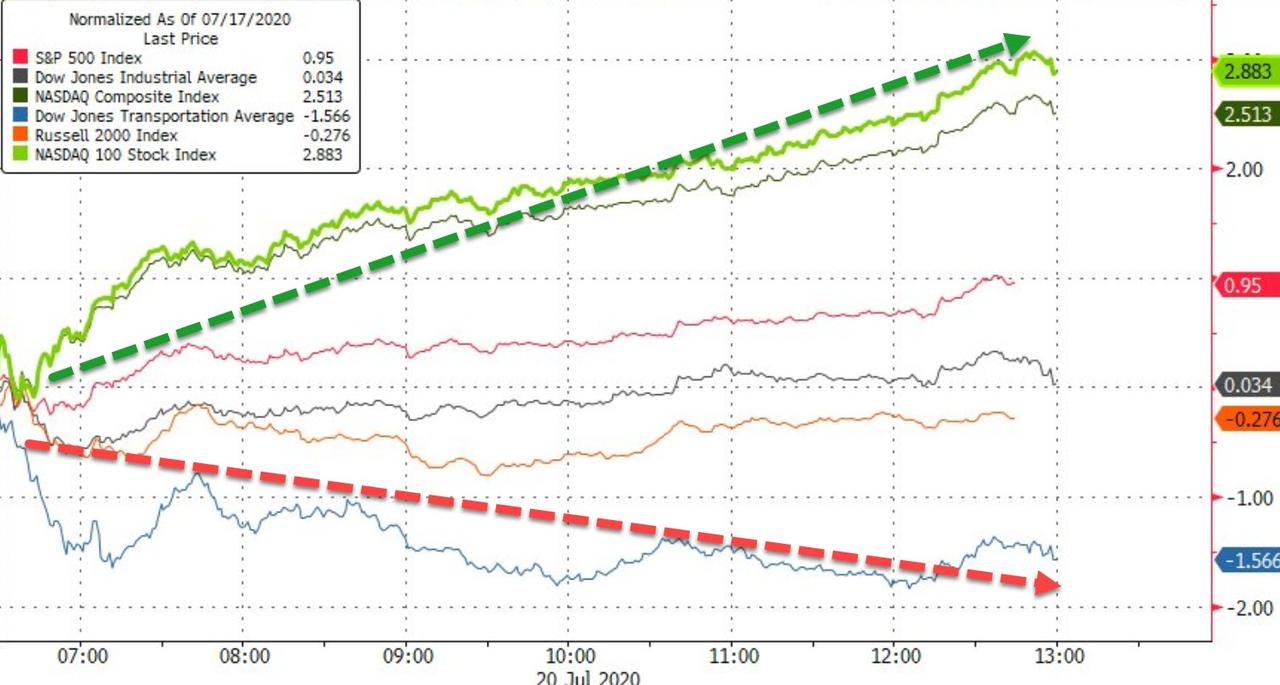
Right after the opening bell, the Nasdaq took over and lead the major indexes via a steady ramp to a green close. The Dow barely closed to the upside, while the S&P 500 showed a decent increase, but that one paled compared to the tech sector’s chest pounding 2.51% surge.

Much of this was based on anticipated earnings during this week, somewhat helped by positive developments from vaccine candidates but overshadowed by coronavirus cases and deaths continuing to set records.

North Carolina, Louisiana, and Kentucky reported record infections of COVID-19 of 2,400, 3,119 and 979 respectively on Sunday, The Wall Street Journal reported, while Arizona registered a record high death tally of 147 deaths.

Meanwhile, Florida, the epicenter of the outbreak in the U.S., reported nearly seven-day average of 12,000 cases, surging by nearly a 30%, according to CNBC, citing data compiled by Johns Hopkins University.

However, this week will be all about earnings and how many companies can beat the sharply reduced expectations, despite realization setting in that the dream of a V-shape type of recovery may be exactly that—a dream. The question remains as to whether the “improved” earnings will be in line with what markets expect, or will they provide a dose of reality?

Added MarketWatch:

Although Wall Street is betting that earnings will start bouncing off the bottom in the third quarter, the beginning point for that bounce is unknown, and early indications suggest the rebound’s magnitude may not match investors’ hopes.

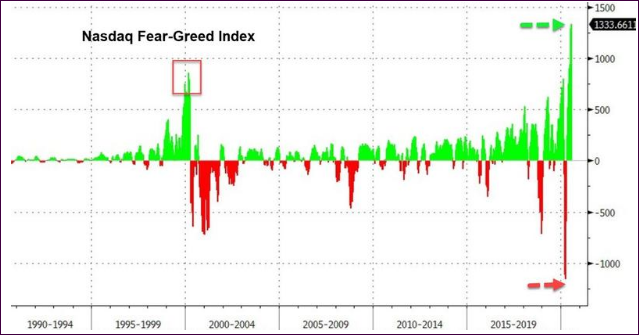
Today has sent Bloomberg’s Fear-Greed index to its highest ever—above March 2000’s previous peak, according to ZH:

The lesson is simple. You cannot be in this market without an exit strategy.

Read More