
ETF Tracker StatSheet
You can view the latest version here.
DIGGING A HOLE AND FAILING TO CLIMB OUT OF IT
- Moving the markets
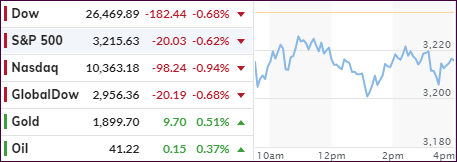
Negative sentiment was clearly present in the futures markets with US indexes falling and Chinese stocks tumbling on increased tensions between the US and China. The tit-for-tat on forcing closures of each other’s consulates continued unabated.
Global stocks took a hit, while domestically Intel shares slumped (some -15%) on a report that a new chip technology would be delayed, causing the entire tech sector to start the regular session in the red.
Even though the Nasdaq came off its worst level of the day, it ended up with back-to-back declines.
Not helping matters was the lack of progress for another fiscal stimulus bill in Washington, while rising coronavirus counts in 40 states were and continues to limit business and consumer activity and creating more doubt about the dream of a V-shape recovery.
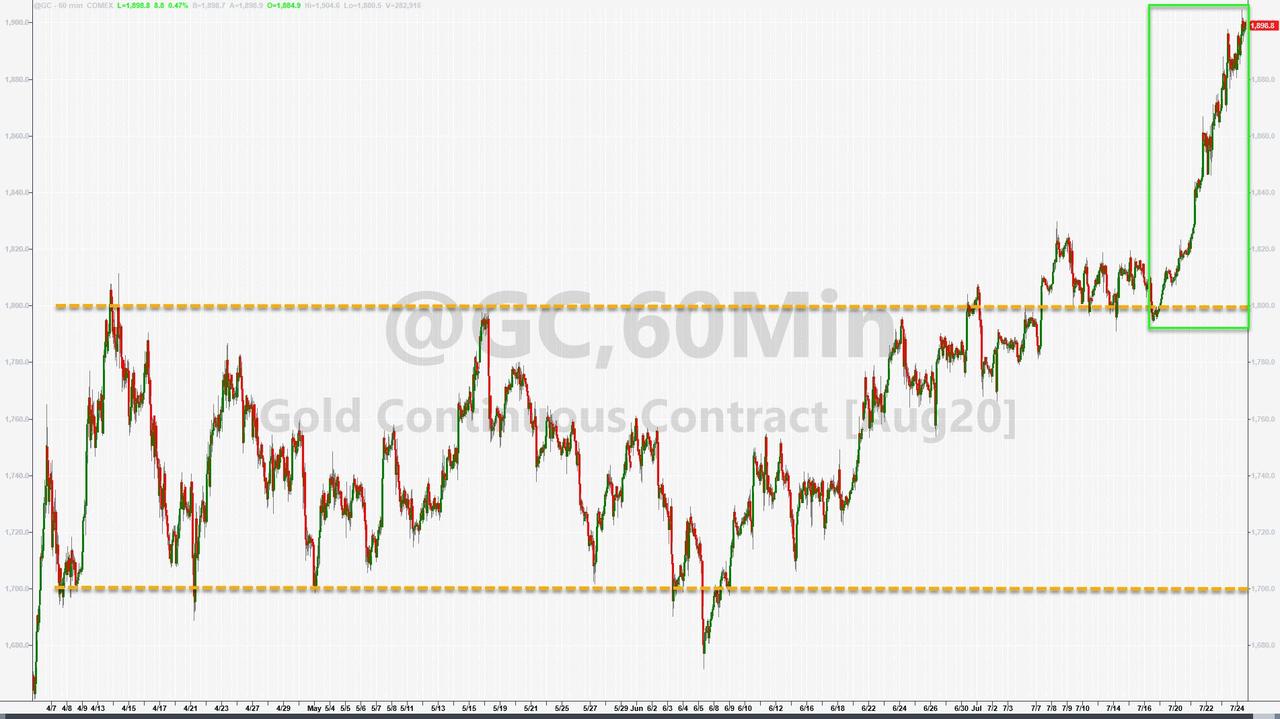
Gold was the standout performer again, offsetting some of the Nasdaq losses. As I pointed out before, I see a lot of upside potential for gold in the future given the reckless and unprecedented money printing efforts by the Fed.
A great explanation about the importance of gold in today’s environment came from Johnny Bravo in an interview with SchiffGold:
“The reason that governments don’t like gold is probably for the same reason that kids don’t like chaperones at the senior prom. Because the chaperones are there to keep the kids in line and prevent them from doing things they really shouldn’t be doing. And that’s really what gold does. It’s kind of like a chaperone for government politicians because it keeps them honest. Because if you have real money, and government wants to spend money on programs, it needs to collect that money in taxes. And that generally puts a brake on a lot of programs because the public doesn’t want to pay.
…
Gold stands in the way, because you can print paper out of thin air. But gold can’t be printed into existence; it needs to be mined. And if we’re on a gold standard, and gold is money, then the government needs real money. And since it doesn’t have the ability to make it, it has to collect it in taxes before it can spend it back into circulation.”
Next week, the markets will be dealing with the looming effects of the expiration of the eviction moratorium.
The Federal Housing Administration (FHA) was able to stop evictions of renters during the coronavirus pandemic. The Coronavirus Aid, Relief, and Economic Security Act (CARES) also made it unlawful for landlords to evict tenants in federally subsidized or federally backed housing. However, those protections are set to expire today (Friday, July 24).
Of course, it’s widely expected that the government will ride to rescue via an extension, but then we also have this:
The end of eviction protection comes as households are being hit with a fiscal cliff. The $600 in weekly federal unemployment assistance for tens of millions of folks is set to expire next week. We’ve called it an “income cliff,” as it would mean consumption would crater, and the recovery would quickly reverse.
These are a lot of issues for the markets to deal with, although they are all known. This week’s pullback was relatively mild with the S&P 500 given back about 0.5%, while none of our trailing sell stops were in danger of being triggered.
2. ETFs in the Spotlight
In case you missed the announcement and description of this section, you can read it here again.
It features some of the 10 broadly diversified domestic and sector ETFs from my HighVolume list as posted every Saturday. Furthermore, they are screened for the lowest MaxDD% number meaning they have been showing better resistance to temporary sell offs than all others over the past year.
The below table simply demonstrates the magnitude with which these ETFs are fluctuating above or below their respective individual trend lines (%+/-M/A). A break below, represented by a negative number, shows weakness, while a break above, represented by a positive percentage, shows strength.
For hundreds of ETF choices, be sure to reference Thursday’s StatSheet.
For this current domestic “Buy” cycle, here’s how some our candidates have fared:
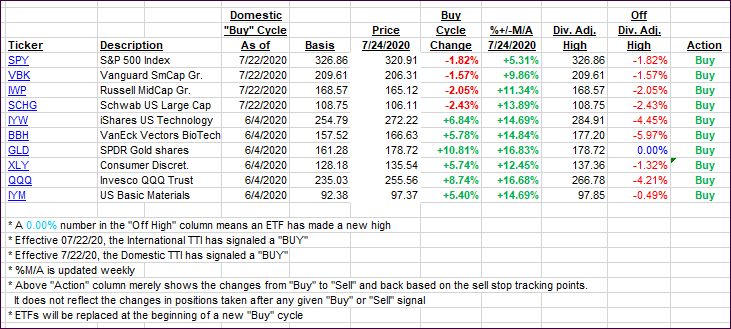
Click image to enlarge
Again, the %+/-M/A column above shows the position of the various ETFs in relation to their respective long-term trend lines, while the trailing sell stops are being tracked in the “Off High” column. The “Action” column will signal a “Sell” once the -8% point has been taken out in the “Off High” column. For more volatile sector ETFs, the trigger point is -10%.
3. Trend Tracking Indexes (TTIs)
Our TTIs headed south, as the bears ruled the day.
This is how we closed 07/24/2020:
Domestic TTI: +2.78% above its M/A (prior close +3.50%)—Buy signal effective 07/22/2020
International TTI: +1.28% above its M/A (prior close +1.83%)—Buy signal effective 07/22/2020
Disclosure: I am obliged to inform you that I, as well as my advisory clients, own some of the ETFs listed in the above table. Furthermore, they do not represent a specific investment recommendation for you, they merely show which ETFs from the universe I track are falling within the specified guidelines.
———————————————————-
WOULD YOU LIKE TO HAVE YOUR INVESTMENTS PROFESSIONALLY MANAGED?
Do you have the time to follow our investment plans yourself? If you are a busy professional who would like to have his portfolio managed using our methodology, please contact me directly or get more details here.
———————————————————
Back issues of the ETF Tracker are available on the web.
Contact Ulli