
- Moving the markets
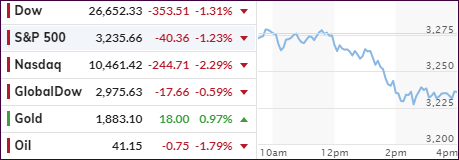
Early weakness in equities prevailed throughout the session, but downward momentum accelerated leaving the major indexes in the red with the Nasdaq taking the brunt of the beating.
As we all know, the tech sector has been on a tear, so corrections are to be expected. Look at this chart below showing the dominance of tech within the S&P 500 composition:
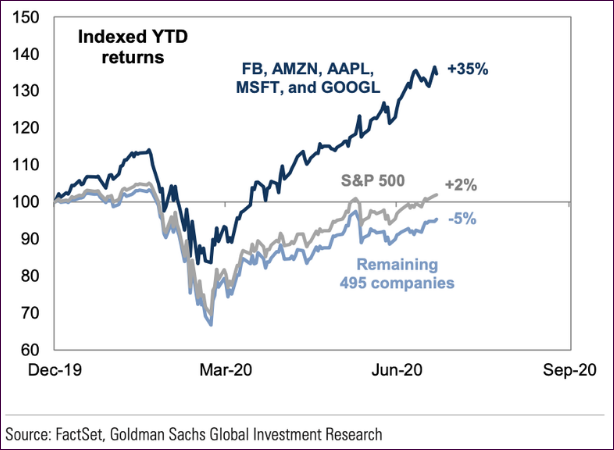
What this demonstrates is downright mindboggling: The five largest stocks have returned 35% YTD; the other 495 stocks have declined by 5%. And as a composite, the S&P has gained +2% YTD!
Late in the session, the slide stopped, in part due to some Fed intervention, as ZH pointed out tongue-in-cheek:
Well, it took it’s sweet time, but at exactly 2:30pm the Fed fired a warning shot at all the racist criminals known as “sellers” when it announced that it had “broadened the set of firms eligible to transact with and provide services in three emergency lending facilities.”
… apparently the Fed decided that the only reason there is not even more demand, is because the program is too… limiting, and so it decided to expand the list of counterparties. The signal was clear: any more selling and the Fed starts buying stocks.
Today’s timeline of events was as follows:
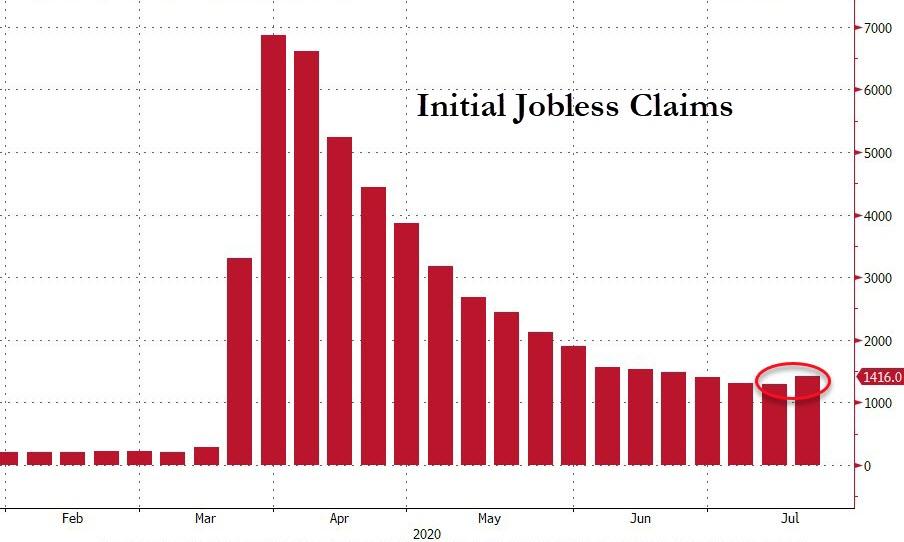
0830ET *FIRST RISE IN INITIAL JOBLESS CLAIMS SINCE MARCH
1035ET *FLORIDA POSTS RECORD 173 DAILY VIRUS DEATHS AMONG RESIDENTS
1320ET *HOUSE ANTITRUST PANEL TO EYE AMAZON, APPLE, FACEBOOK, GOOGLE
1335ET *APPLE FACING MULTI-STATE CONSUMER PROTECTION PROBE
But then, in a panicked moment from The Fed as losses accelerated, the collapse stalled as this hit…
1430ET *FED BROADENS FIRMS IT WILL TRANSACT WITH ON THREE LOAN PROGRAMS
We will find out tomorrow if the Fed’s signal was received and accepted, or if the bears continue to have another day in the limelight.
2. ETFs in the Spotlight
In case you missed the announcement and description of this section, you can read it here again.
It features some of the 10 broadly diversified domestic and sector ETFs from my HighVolume list as posted every Saturday. Furthermore, they are screened for the lowest MaxDD% number meaning they have been showing better resistance to temporary sell offs than all others over the past year.
The below table simply demonstrates the magnitude with which these ETFs are fluctuating above or below their respective individual trend lines (%+/-M/A). A break below, represented by a negative number, shows weakness, while a break above, represented by a positive percentage, shows strength.
For hundreds of ETF choices, be sure to reference Thursday’s StatSheet.
For this new domestic “Buy” cycle, which ended effective 6/25/2020, here’s how some our candidates have fared:
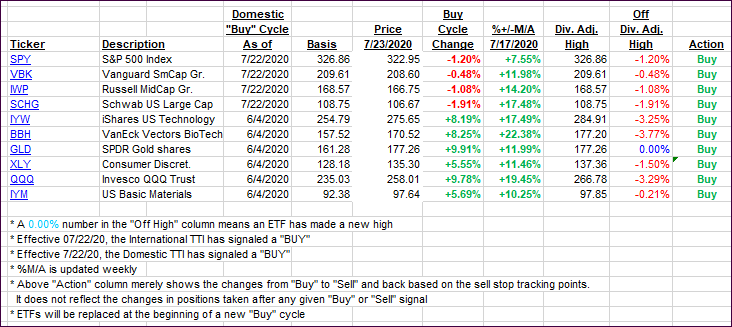
Click image to enlarge
Again, the %+/-M/A column above shows the position of the various ETFs in relation to their respective long-term trend lines, while the trailing sell stops are being tracked in the “Off High” column. The “Action” column will signal a “Sell” once the -8% point has been taken out in the “Off High” column. For more volatile sector ETFs, the trigger point is -10%.
3. Trend Tracking Indexes (TTIs)
Our TTIs slipped a tad, but it did not affect our current “Buy” signals.
This is how we closed 07/23/2020:
Domestic TTI: +3.50% above its M/A (prior close +3.68%)—Buy signal effective 07/22/2020
International TTI: +1.83% above its M/A (prior close +2.39%)—Buy signal effective 07/22/2020
Disclosure: I am obliged to inform you that I, as well as my advisory clients, own some of the ETFs listed in the above table. Furthermore, they do not represent a specific investment recommendation for you, they merely show which ETFs from the universe I track are falling within the specified guidelines.
Contact Ulli