Weekly StatSheet For The ETF Tracker Newsletter – Updated Through 07/30/2020

Ulli ETF StatSheet Contact

ETF Data updated through Thursday, July 30, 2020
Methodology/Use of this StatSheet:

1. From the universe of over 1,800 ETFs, I have selected only those with a trading volume of over $5 million per day (HV ETFs), so that liquidity and a small bid/ask spread are assured.

2. Trend Tracking Indexes (TTIs)

Buy or Sell decisions for Domestic and International ETFs (section 1 and 2), are made based on the respective TTI and its position either above or below its long-term M/A (Moving Average). A crossing of the trend line from below accompanied by some staying power above constitutes a “Buy” signal. Conversely, a clear break below the line constitutes a “Sell” signal. Additionally, I use a 7.5% trailing stop loss on all positions in these categories to control downside risk.

3. All other investment arenas do not have a TTI and should be traded based on  the position of the individual ETF relative to its own respective trend line (%M/A). That’s why those signals are referred to as a “Selective Buy.” In other words, if an ETF crosses its own trendline to the upside, a “Buy” signal is generated. Since these areas tend to be more volatile, I recommend a wider trailing sell stop of 7.5% -10% depending on your risk tolerance.

If you are unfamiliar with some of the terminology, please see Glossary of Terms and new subscriber information in section 9.     

1. DOMESTIC EQUITY ETFs: BUY — since 07/22/2020
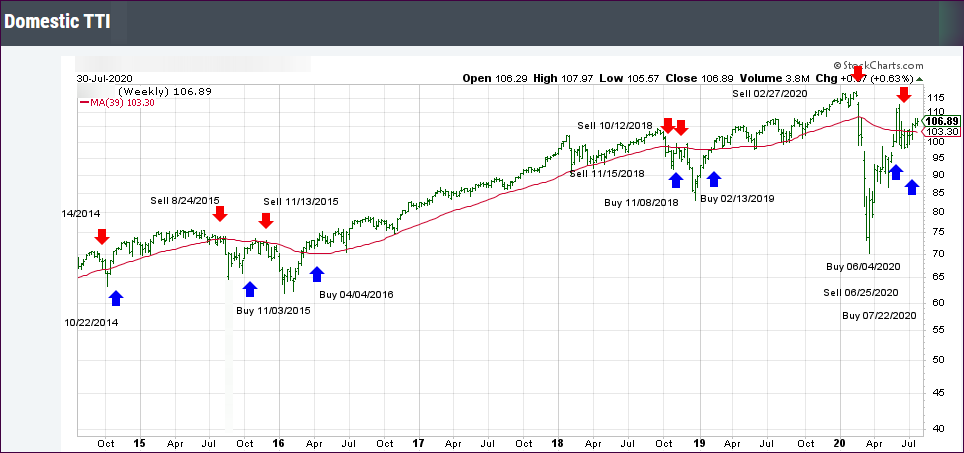
Click on chart to enlarge

Our main directional indicator, the Domestic Trend Tracking Index (TTI-green line in the above chart) has now rallied above its long-term trend line (red) by +3.43% and is in “BUY” mode as posted.

Read More
Plunging Economy—Nasdaq Survives Weakness

Ulli Market Commentary Contact

[Chart courtesy of MarketWatch.com]

  1. Moving the markets

Early this morning, the Dow was down some 500 points, and other major indexes showed similar weakness, as the US economy plunged an enormous as well as unprecedented -32.9% in the second quarter confirming what I have said before: There is no V-shape recovery on the horizon. At best, we can hope for a drawn-out version.

ZH provided these details:

And while the drop – which was generally priced in – was some 5 times worse than the adjusted Q1 GDP of -6.9%, it was just fractionally better than the -34.5% expected. Then again, with a third of the US economy effectively going offline in Q2, a worse outcome than during the great depression, a few percent here and there doesn’t really matter.

The second-quarter decrease in real GDP reflected decreases in consumer spending, exports, inventory investment, business investment, and housing investment that were partially offset by an increase in government spending. Imports, a subtraction in the calculation of GDP, decreased.

That said, the biggest contributor to the overall GDP drop was the crash in consumption – the decrease in consumer spending reflected decreases in services (led by health care) and goods (led by clothing and footwear).

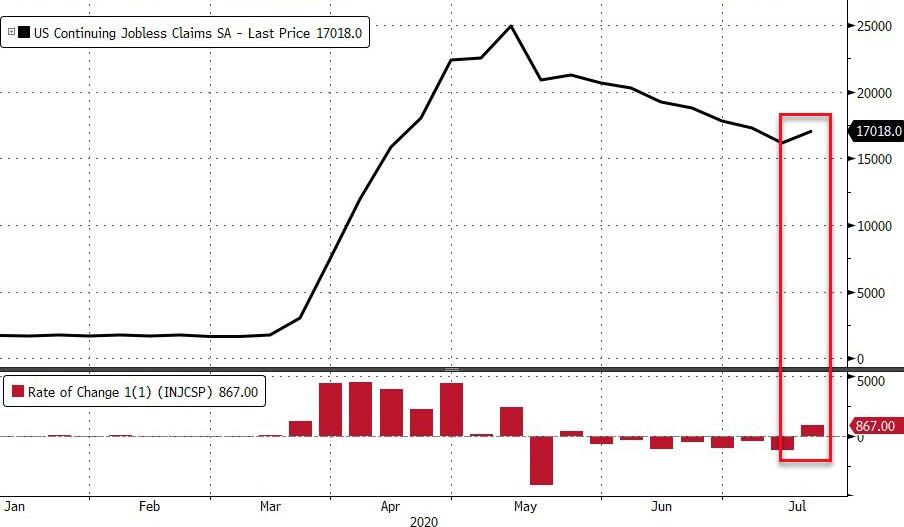
As if that was not bad enough, a rise in initial jobless claims for the second straight week indicated that economic activity has slowed down as opposed to satisfying the prospects of growth. Continuing jobless claims disappointed as well, as they rose for the first time in 8 weeks from 16.15 million to 17.02 million, according to ZH.

That means, a total of 54.13 million Americans has now applied for jobless benefits for the first time since the lockdowns began. That equates to almost 1/3 of the working population. Ouch!

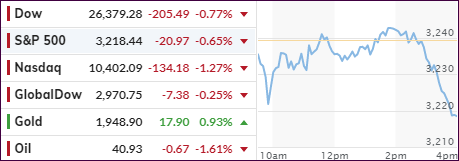
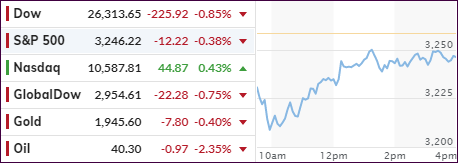
The markets headed south in a hurry but managed to climb out of that initial hole and recovered most of the early losses. The Nasdaq ended up in the green by a comfortable margin, with the Dow and S&P 500 remaining in the red, as the former lagged all indexes.

In the end, the sell-off could have been far worse, so it’s now up the after-hours tech earnings to determine whether we will see red or green numbers tomorrow.

Read More

Fed Satisfies Markets

Ulli Market Commentary Contact

[Chart courtesy of MarketWatch.com]

  1. Moving the markets

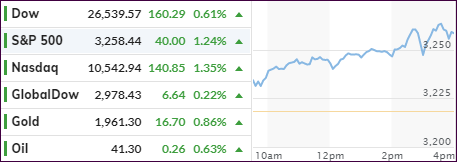
Markets were in a bullish mood right after the opening bell and slowly ascended in anticipation of positive news from the Fed meeting.

That turned out to be the case, as the Federal Reserve left benchmark interest rates unchanged and promised to provide support until the threat of further negative economic impact by the coronavirus has passed.

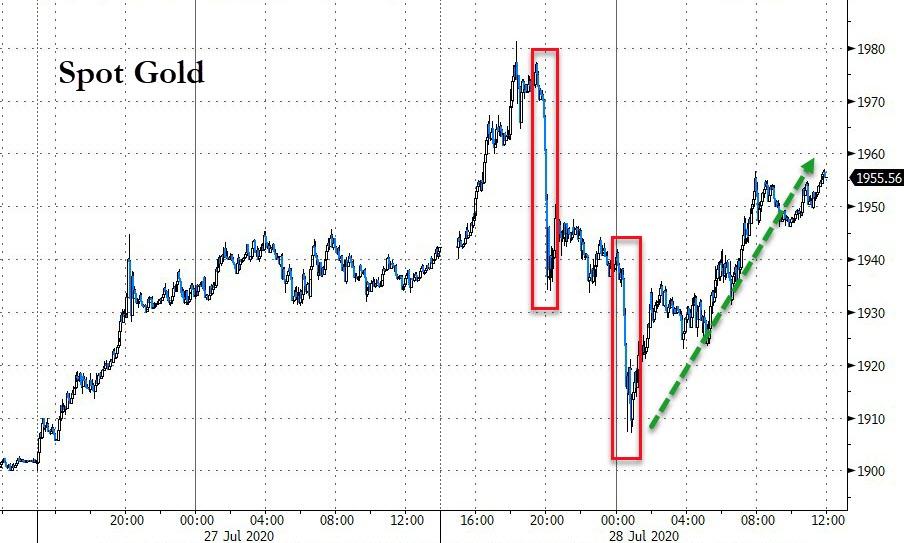
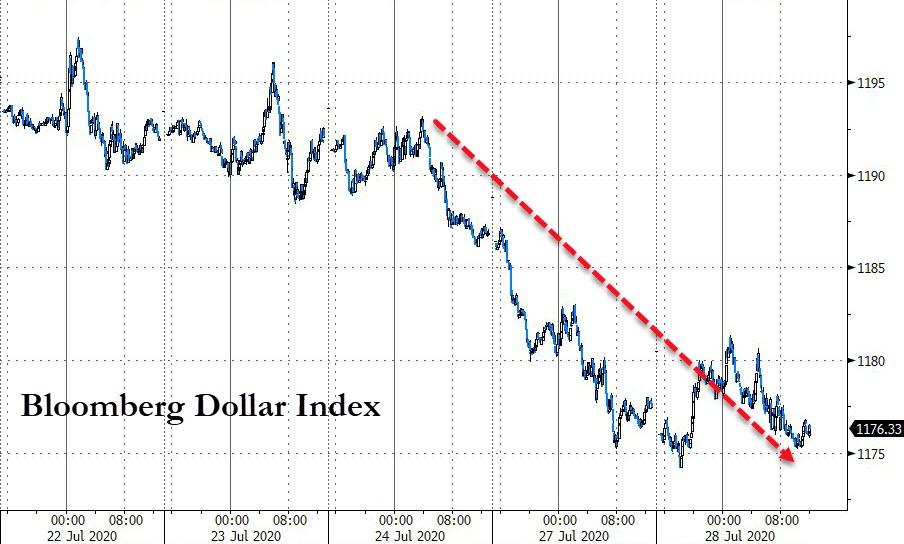
Assurances and hints like “do whatever I can do for as long as it takes,” were enough to send stocks and gold higher, while the US Dollar continued on its southerly path. This was exactly what markets had expected, and up we went.

ZH summed it up like this:

Powell initially promised The Fed will “do whatever it takes for as long as it takes” and stocks and gold spiked.

Everything was fine until Powell reiterated a statement on the pace of recovery slowing and everything reversed.

But then Powell promised to “adjust forward guidance and asset-buying if needed” and the market assumed that if the recovery is slowing that can only mean MOAR!!!!

And stocks rallied back to their highs with Small Caps dramatically outperforming (as The Dow lagged) …

But, one portfolio manager was cautious:

“The market was operating under the assumption that the Fed will do whatever it has to do to support the market” and policy makers “didn’t disappoint on that front,” said Phil Toews, chief executive and lead portfolio manager of New York-based Toews Corp., which manages $1.9 billion.

“If markets falter over the coming months, the ability of the Fed to act as a put under the markets will be tested,” Toews said via email; “if markets begin to fall despite the Fed’s bond-buying power, it would be a tipping point that would be a huge sell indicator.”

I agree with this assessment, just because the Fed shows its willingness to support the markets, does not mean they will be able to execute as planned, but I am certain that their fortitude will be tested at some time in the future.

Tomorrow’s massive earnings reports will likely influence market direction, but for right now, we’re enjoying the bullish ride.

Read More

Markets Drift—And Dive Into The Close

Ulli Market Commentary Contact

[Chart courtesy of MarketWatch.com]

  1. Moving the markets

Most traders were glued to their monitors today, trying to watch the talks between Republicans and Democrats wrangling for a mutually acceptable solution on a second coronavirus aid package.

Noted MarketWatch:

A fight looms over supplemental unemployment benefits, with Democrats eager to maintain the existing $600 weekly supplement, while the Republican plan would reduce it to a $200 add-on through September. The supplemental jobless benefits are due to expire at the end of the month. Democrats and Republicans also want to issue another round of stimulus checks but disagree on the details.

With no result on the horizon so far and a deluge of earnings on deck for Thursday, as well as the outcome of the Fed’s policy meeting tomorrow, it came as no surprise that the markets meandered aimlessly, drifted lower and ended up diving into the close.

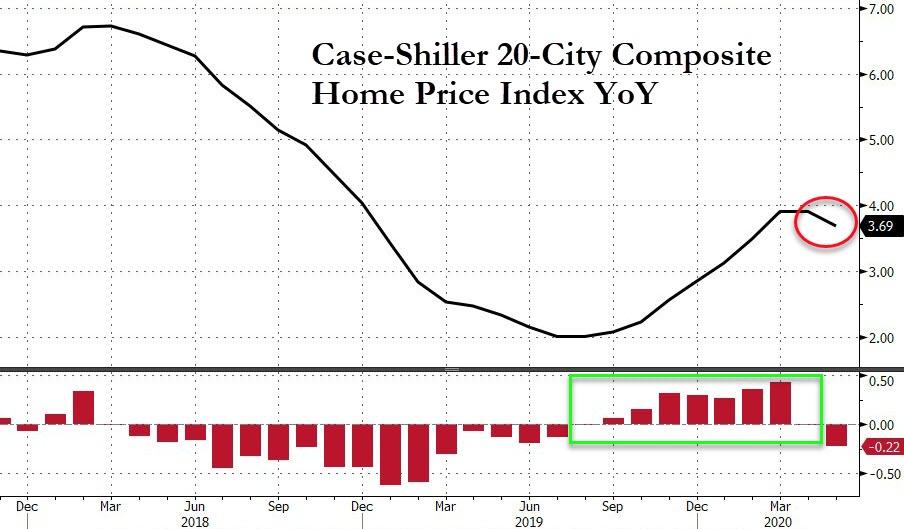
Economic data did nothing to support the bulls with Consumer Confidence sliding in July to 91.5 from 106.1 the prior month, which obviously does not indicate a “V-shape” type of recovery. We also learned that Home price appreciation, which had accelerated nine straight months, hit a brick wall and slowed from its torrid pace.

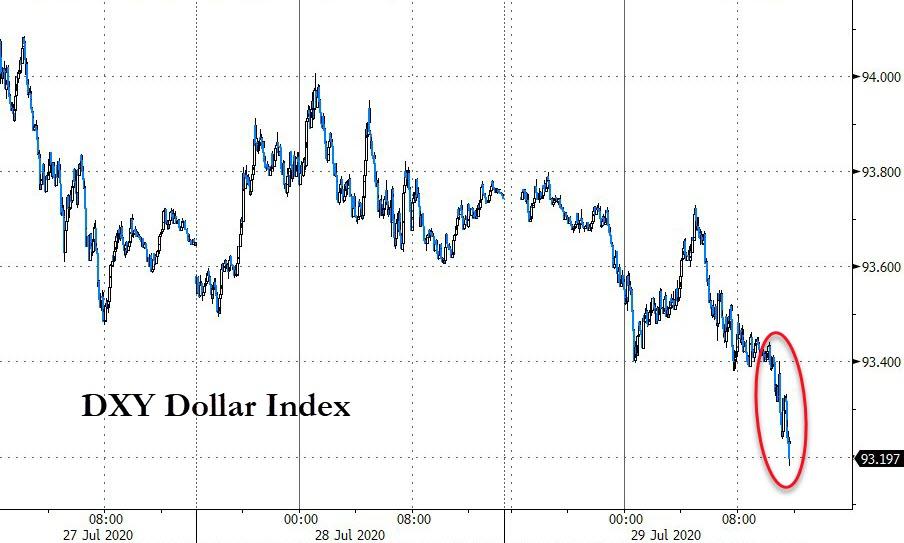
But again, the shining light was gold with GLD scoring another gain of +0.85%, while the US Dollar index continued its slippery slide.

With the upcoming events mentioned above, we may be in for some fireworks the rest of the week.

Read More

Gold Jumps And Dollar Dumps

Ulli Market Commentary Contact

[Chart courtesy of MarketWatch.com]

  1. Moving the markets

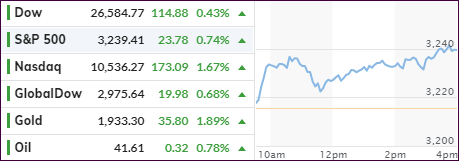
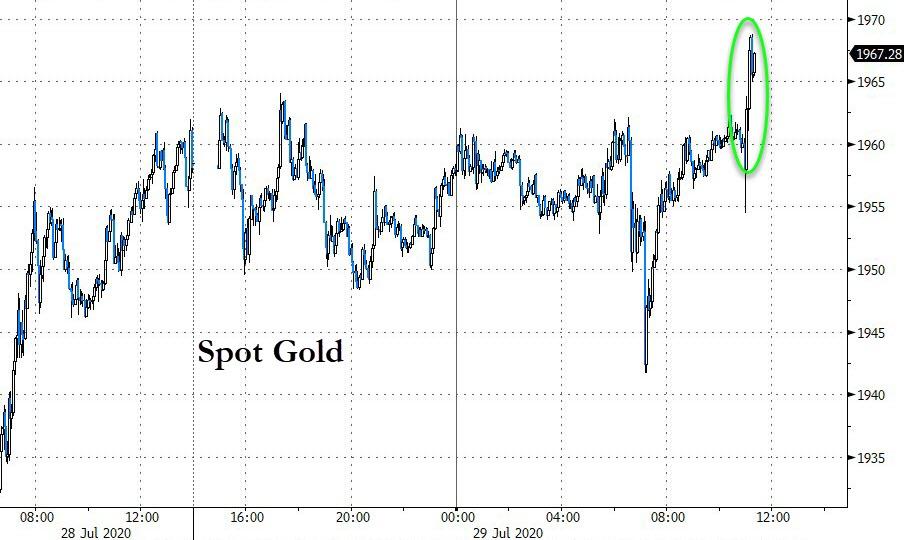
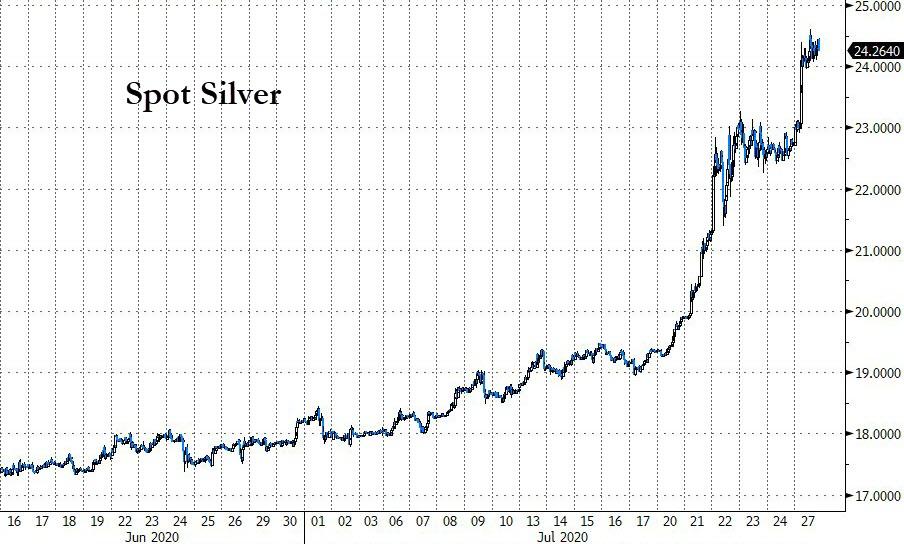
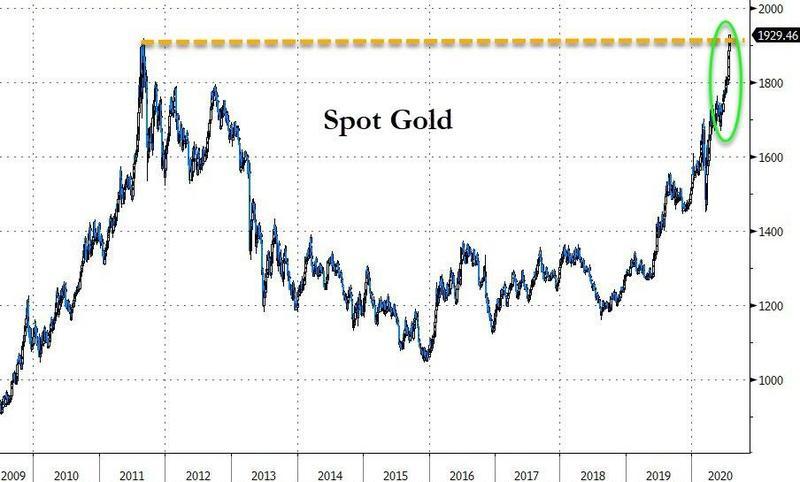
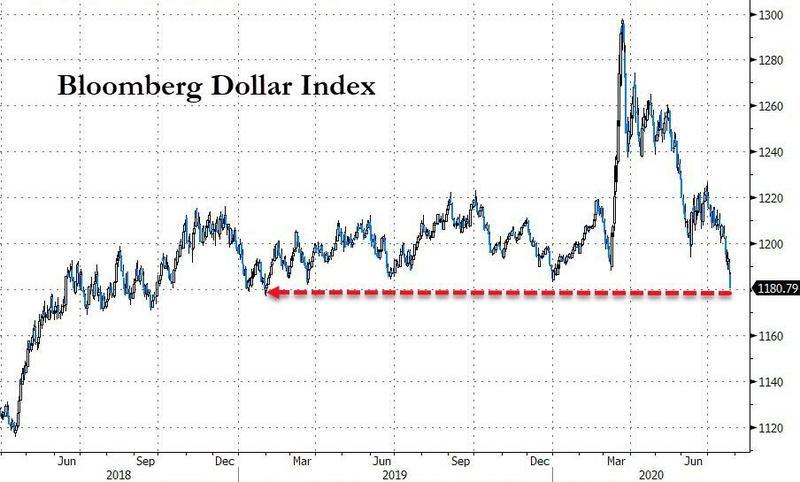
Gold’s rally continued today, as the precious metal settled at the highest price in history, namely $1,931 with silver recapturing the $24.50 level. As gold popped, the US dollar dropped, which was to be expected as these two asset classes move in opposite direction.

Equities followed gold to the upside with especially the Nasdaq regaining last week’s lost momentum by powering ahead +1.67%. Hope reigns supreme that the coronavirus rescue program by lawmakers turns out positive, and that this upcoming busiest week for the earnings season offers no unexpected surprises.

“There is a very strong case to be made for additional fiscal stimulus. Both sides of the political aisle want to get something down,” said Talley Leger, senior investment strategist for Invesco, in an interview.

He noted high-frequency data tracking movements of Americans, shopping habits and dining reservations had stalled in several states, suggesting the steady recovery in U.S. economic activity thus far was at risk of coming apart.

Today’s Durable Goods orders for June jumped 7.3%, but whether that is simply an outlier or the beginning of a new trend remains to be seen.

On deck for Tuesday and Wednesday is the Fed’s 2-day policy meeting on interest rates with no changes to be expected other than Fed head Powell maintaining his dovish views.

The big tech companies and other powerhouses will report earnings on Thursday including:

Alphabet, Amazon, Apple, Facebook, Samsung, Nestle, Procter & Gamble, Comcast, L’Oreal, Stanley Black & Decker, AstraZeneca, Linde, Mastercard, American Tower, AB InBev, Total, Volkswagen, Ford, Royal Dutch Shell, Lloyds Banking Group and Credit Suisse.

It promises to be an interesting week, possibly full of surprises.

Read More

ETFs On The Cutline – Updated Through 07/24/2020

Ulli ETFs on the Cutline Contact

ETFs On The Cutline – Updated Through 07/24/2020

Below, please find the latest High-Volume ETF Cutline report, which shows how far above or below their respective long-term trend lines (39-week SMA) my currently tracked ETFs are positioned.

This report covers the HV ETF Master List from Thursday’s StatSheet and includes 312 High Volume ETFs, defined as those with an average daily volume of more than $5 million, of which currently 198 (last week 186) are hovering in bullish territory. The yellow line separates those ETFs that are positioned above their trend line (%M/A) from those that have dropped below it.

Take a look:                                                                   

The HV ETF Master Cutline Report

In case you are not familiar with some of the terminology used in the reports, please read the Glossary of Terms.

If you missed the original post about the Cutline approach, you can read it here.