
- Moving the markets
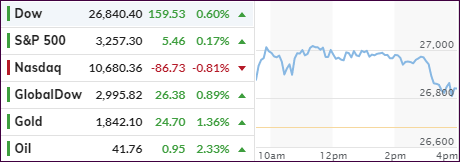
While equities and gold usually diverge, today both gained, but the precious metal put on a superior performance with GLD adding +1.22% vs. the S&P 500s meager +0.17%. After the Nasdaq’s outstanding outing yesterday, the tech sector was due for a time out, and the index surrendered -0.81%.
Market sentiment was cheerful after the EU reached a historic pandemic bailout deal, as ZH called it, with a massive $860 billion recovery plan for their coronavirus-throttled economies. The tug-of-war to come to a solution spanned some 5 days and included a variety of turbulent and seemingly endless negotiating sessions.
Despite early sharp advances, the gains ended up being muted with the S&P attempting to break out of a 6-week trading range.
“The S&P 500 is breaking out of trading range,” said Crista Huff, founder of hedge fund Freedom Investment Partners, told MarketWatch. “We are beginning a bull run.” But “Clearly we have some massive problems in the economy and there are so many people that are unemployed and 10 or 20 million aren’t going to have an easy time finding a new job,” she added.
Still, some sectors performed well giving our Trend Tracking Indexes (TTIs) the boost they needed to validate new Buy signals. Please see section 3 for details.
Analyst Lance Roberts shows the seasonal effects on the S&P 500 as an average of all years in this chart:
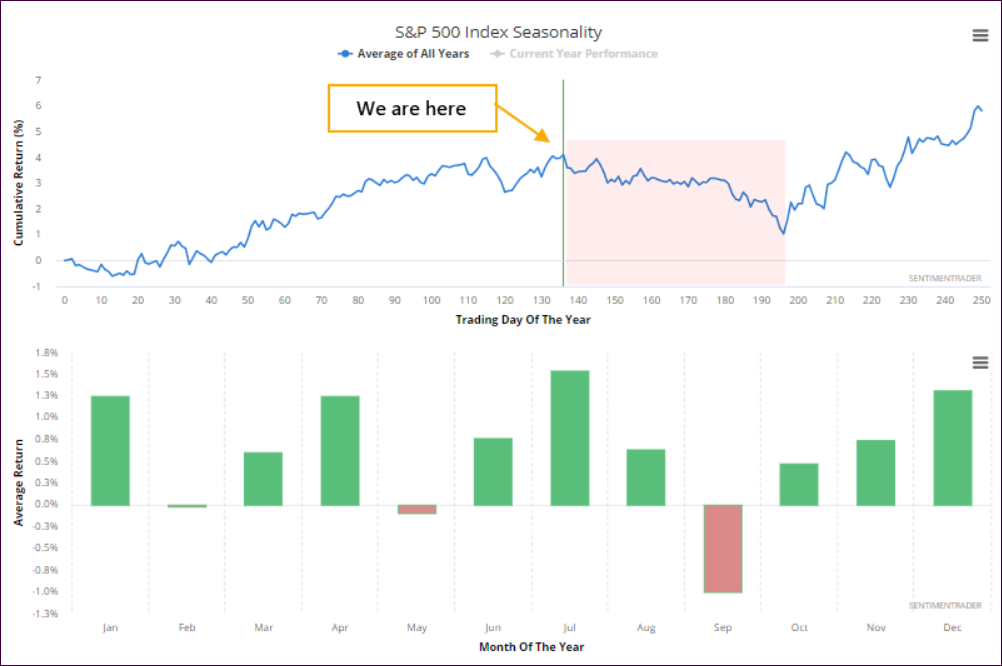
As you can see, we are still in the seasonally strong part of the year, and the obvious question to me is this one: “Will a potential correction in September be strong enough to trigger our trailing sell stops?”
Since no one has the answer, we will continue to follow the major trends and step aside should they get interrupted.
2. ETFs in the Spotlight
In case you missed the announcement and description of this section, you can read it here again.
It features some of the 10 broadly diversified domestic and sector ETFs from my HighVolume list as posted every Saturday. Furthermore, they are screened for the lowest MaxDD% number meaning they have been showing better resistance to temporary sell offs than all others over the past year.
The below table simply demonstrates the magnitude with which these ETFs are fluctuating above or below their respective individual trend lines (%+/-M/A). A break below, represented by a negative number, shows weakness, while a break above, represented by a positive percentage, shows strength.
For hundreds of ETF choices, be sure to reference Thursday’s StatSheet.
For this new domestic “Buy” cycle, which ended effective 6/25/2020, here’s how some our candidates have fared:
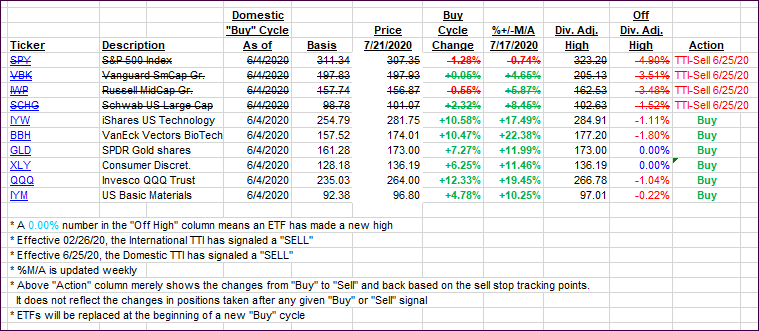
Click image to enlarge
Again, the %+/-M/A column above shows the position of the various ETFs in relation to their respective long-term trend lines, while the trailing sell stops are being tracked in the “Off High” column. The “Action” column will signal a “Sell” once the -8% point has been taken out in the “Off High” column. For more volatile sector ETFs, the trigger point is -10%.
3. Trend Tracking Indexes (TTIs)
Both of our TTIs received a boost and moved deeper into bullish territory. Considering the recent staying power above the lines, we now have a dual Buy signal.
The Domestic one applies to “Domestic broadly diversified ETFs/Mutual Funds.”
The International one applies to “International broadly diversified ETFs/Mutual Funds.”
Again, I will wait for the market opening to see if there is a large correction in the making, in which case I will hold off for another day.
If you follow along, you should consider your risk tolerance before investing.
As I said before, these Buys signals will have only a minor effect in my advisory business, since we already are invested in a variety of sector funds, which run on their own cycles.
This is how we closed 07/21/2020:
Domestic TTI: +2.85% above its M/A (prior close +1.84%)—Sell signal effective 06/25/2020
International TTI: +2.52% above its M/A (prior close +1.64%)—Sell signal effective 02/26/2020
Disclosure: I am obliged to inform you that I, as well as my advisory clients, own some of the ETFs listed in the above table. Furthermore, they do not represent a specific investment recommendation for you, they merely show which ETFs from the universe I track are falling within the specified guidelines.
Contact Ulli