
ETF Tracker StatSheet
You can view the latest version here.
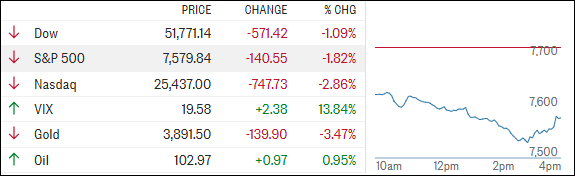
RISK-OFF FRIDAY: TECH, CRYPTO, AND METALS HEAD SOUTH TOGETHER
[Chart courtesy of MarketWatch.com]
- Moving the market
If October taught investors anything, it’s that markets eventually start asking for the receipt. After two years of AI-driven enthusiasm, Friday felt like a reality check as investors rotated out of the high-flying AI names and into more defensive corners of the market.
The Nasdaq led the way lower as disappointing reports from Amazon, Intel, and several chip-related names raised fresh questions about the pace and profitability of AI spending.
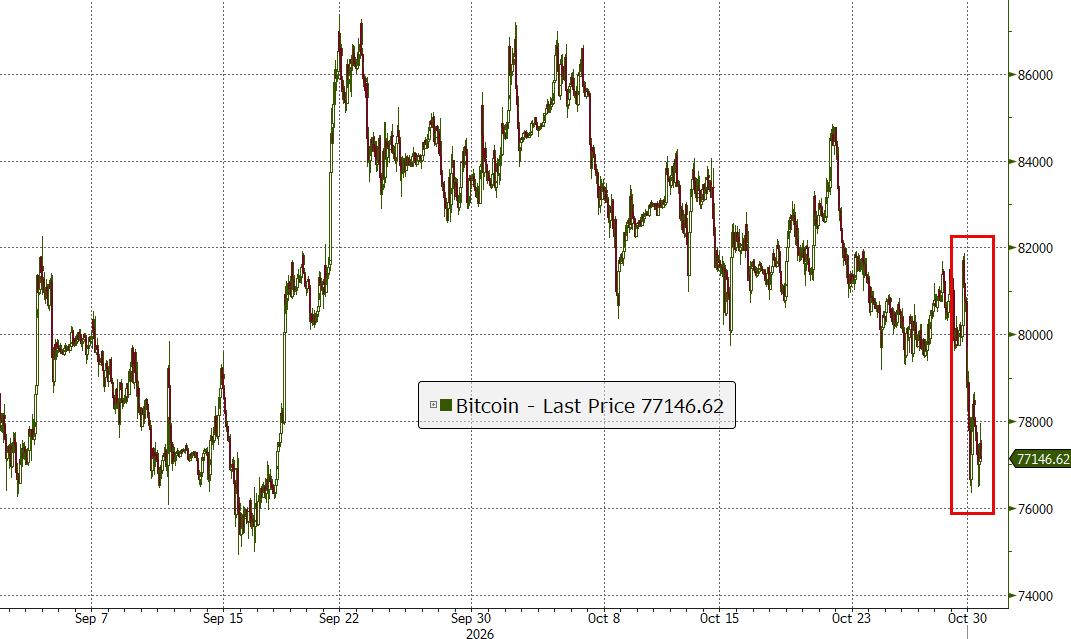
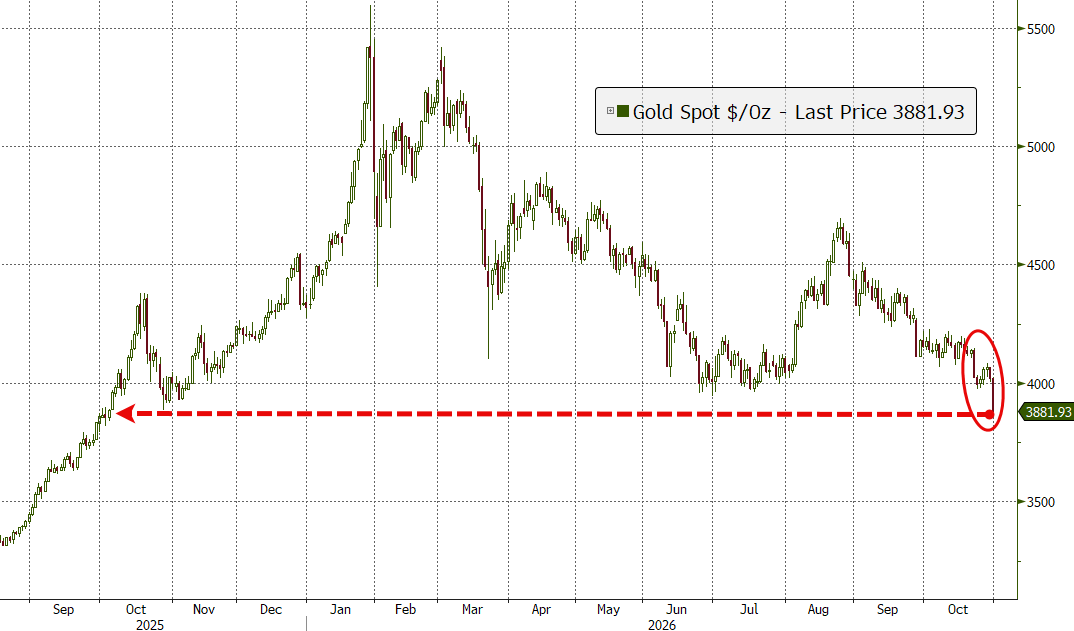
Meanwhile, a massive crypto exchange hack added to the risk-off mood, pushing Bitcoin lower and dragging metals down right alongside it.
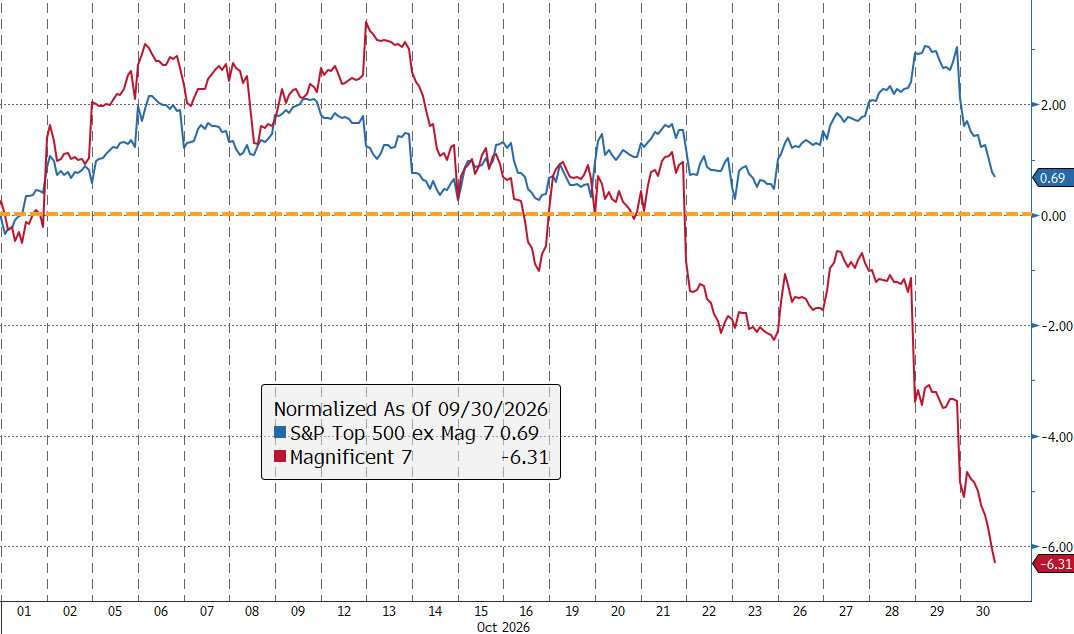
Even the “Magnificent 7” had a rough month, while the other 493 companies in the S&P quietly held their ground, a reminder that the market isn’t always telling the same story beneath the surface.
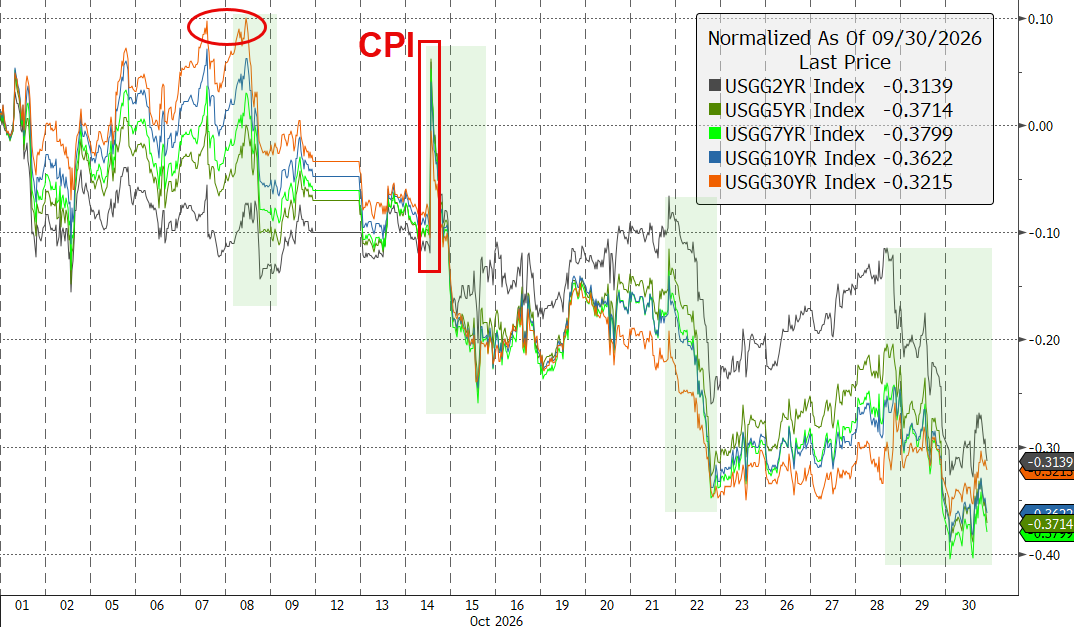
Bond yields finally caught a bid, oil kept climbing, and October closed with plenty of investors wondering whether the AI trade has merely hit a speed bump or if it’s entering a longer period of digestion.
With the midterm-election tailwind now the next hopeful narrative, the question is: will history come to the rescue, or is the market asking for a little more proof before handing out rewards again?
2. Current domestic “Buy” Cycle (effective 5/20/2025); International “Buy” Cycle (effective 5/8/25)
Our domestic bullish cycle that began on November 21, 2023, concluded on April 3, 2025, following a market downturn triggered by President Trump’s tariff policy announcement.
This development caused significant declines across major indexes and broader market indices. However, markets subsequently rebounded, culminating in a new domestic “Buy” signal taking effect May 20, 2025.
Concurrently, our International Trend Tracking Index (TTI) experienced parallel volatility. On April 4, 2025, it breached critical thresholds, prompting a “Sell” recommendation. This position reversed as global markets recovered, with the International TTI regaining sufficient momentum to issue a new “Buy” signal effective May 8, 2025.
3. Trend Tracking Indexes (TTIs)
Month-end Friday was one of those days when stocks, crypto, and bond prices all seemed to agree on one thing: down. Oil, meanwhile, didn’t get the memo and climbed to a six-month high.
Metals and Bitcoin joined the selloff, leaving investors searching for a hiding place that apparently didn’t exist.
Our TTIs pulled back as well, but they held up noticeably better than the major indexes.
More importantly, they remain above their long-term trend lines, which keeps the bigger-picture outlook firmly bullish. Not every day in the market is pretty, but the trend is still our friend.
This is how we closed 10/30/2026:
Domestic TTI: +6.35% above its M/A (prior close +6.48%)—Buy signal effective 5/20/25.
International TTI: +3.27% above its M/A (prior close +4.19%)—Buy signal effective 5/8/25.
All linked charts above are courtesy of Bloomberg via ZeroHedge.
———————————————————-
WOULD YOU LIKE TO HAVE YOUR INVESTMENTS PROFESSIONALLY MANAGED?
Do you have the time to follow our investment plans yourself? If you are a busy professional who would like to have his portfolio managed using our methodology, please contact me directly to get more details.
Contact Ulli