
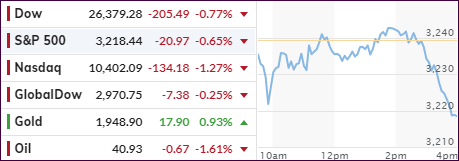
- Moving the markets
Most traders were glued to their monitors today, trying to watch the talks between Republicans and Democrats wrangling for a mutually acceptable solution on a second coronavirus aid package.
Noted MarketWatch:
A fight looms over supplemental unemployment benefits, with Democrats eager to maintain the existing $600 weekly supplement, while the Republican plan would reduce it to a $200 add-on through September. The supplemental jobless benefits are due to expire at the end of the month. Democrats and Republicans also want to issue another round of stimulus checks but disagree on the details.
With no result on the horizon so far and a deluge of earnings on deck for Thursday, as well as the outcome of the Fed’s policy meeting tomorrow, it came as no surprise that the markets meandered aimlessly, drifted lower and ended up diving into the close.
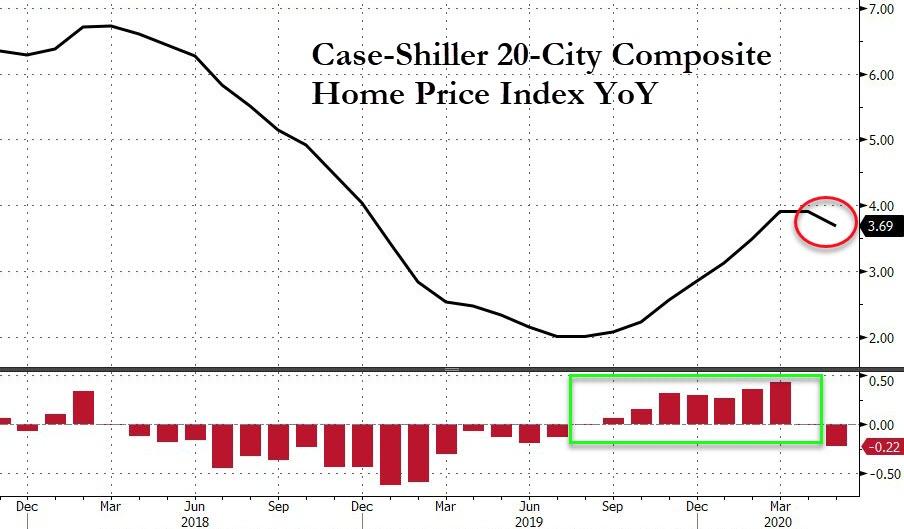
Economic data did nothing to support the bulls with Consumer Confidence sliding in July to 91.5 from 106.1 the prior month, which obviously does not indicate a “V-shape” type of recovery. We also learned that Home price appreciation, which had accelerated nine straight months, hit a brick wall and slowed from its torrid pace.
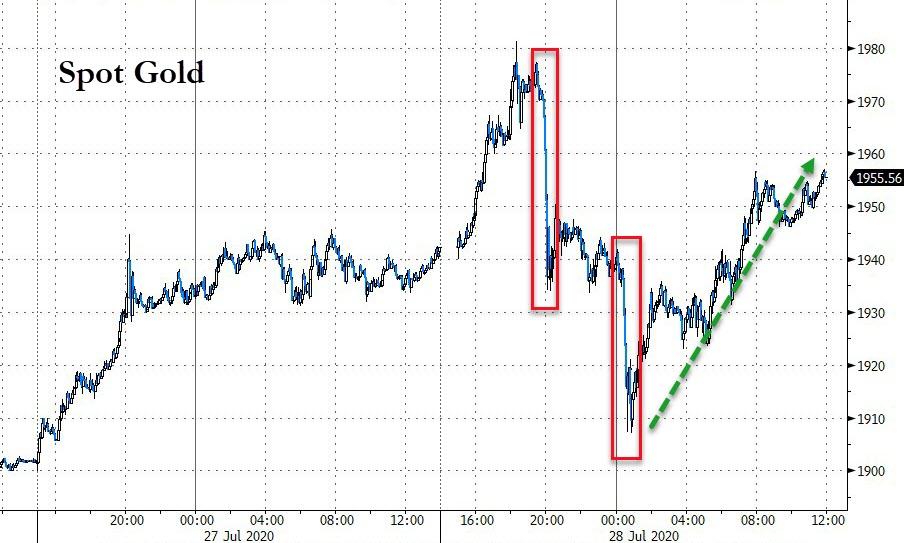
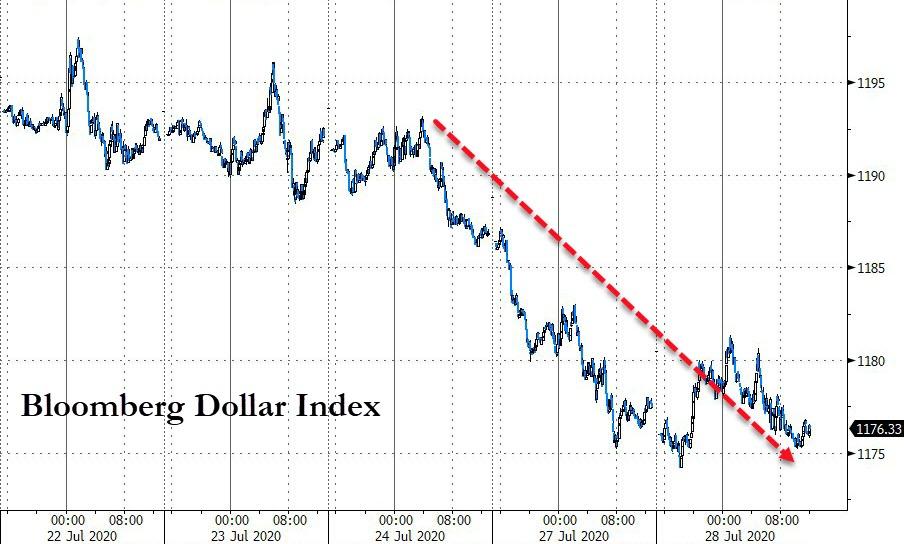
But again, the shining light was gold with GLD scoring another gain of +0.85%, while the US Dollar index continued its slippery slide.
With the upcoming events mentioned above, we may be in for some fireworks the rest of the week.
2. ETFs in the Spotlight
In case you missed the announcement and description of this section, you can read it here again.
It features some of the 10 broadly diversified domestic and sector ETFs from my HighVolume list as posted every Saturday. Furthermore, they are screened for the lowest MaxDD% number meaning they have been showing better resistance to temporary sell offs than all others over the past year.
The below table simply demonstrates the magnitude with which these ETFs are fluctuating above or below their respective individual trend lines (%+/-M/A). A break below, represented by a negative number, shows weakness, while a break above, represented by a positive percentage, shows strength.
For hundreds of ETF choices, be sure to reference Thursday’s StatSheet.
For this current domestic “Buy” cycle, here’s how some our candidates have fared:

Click image to enlarge
Again, the %+/-M/A column above shows the position of the various ETFs in relation to their respective long-term trend lines, while the trailing sell stops are being tracked in the “Off High” column. The “Action” column will signal a “Sell” once the -8% point has been taken out in the “Off High” column. For more volatile sector ETFs, the trigger point is -10%.
3. Trend Tracking Indexes (TTIs)
Our TTIs did an about face and slipped with the major indexes.
This is how we closed 07/28/2020:
Domestic TTI: +2.56% above its M/A (prior close +3.19%)—Buy signal effective 07/22/2020
International TTI: +1.78% above its M/A (prior close +1.94%)—Buy signal effective 07/22/2020
Disclosure: I am obliged to inform you that I, as well as my advisory clients, own some of the ETFs listed in the above table. Furthermore, they do not represent a specific investment recommendation for you, they merely show which ETFs from the universe I track are falling within the specified guidelines.
Contact Ulli