
- Moving the markets
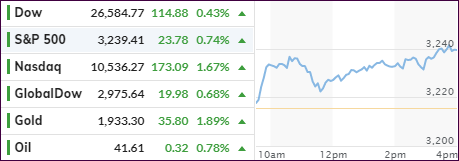
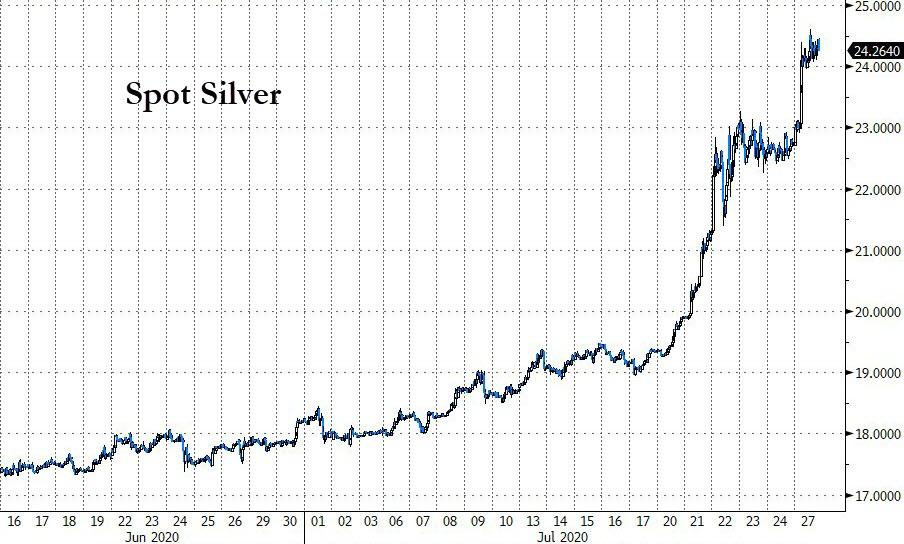
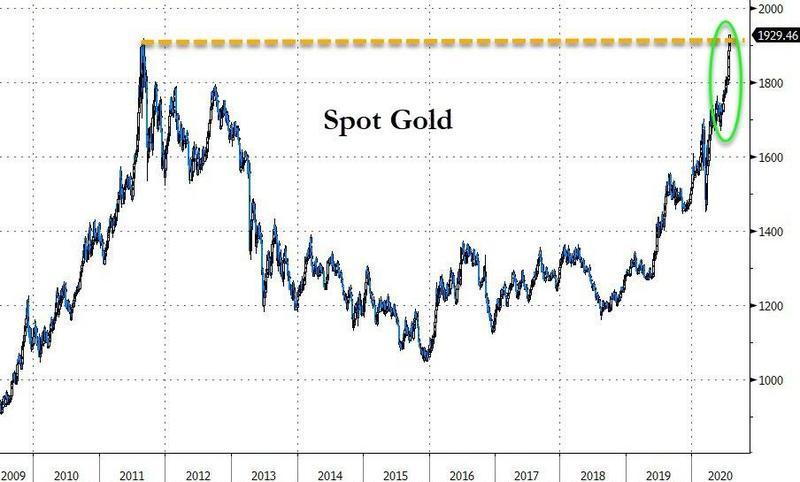
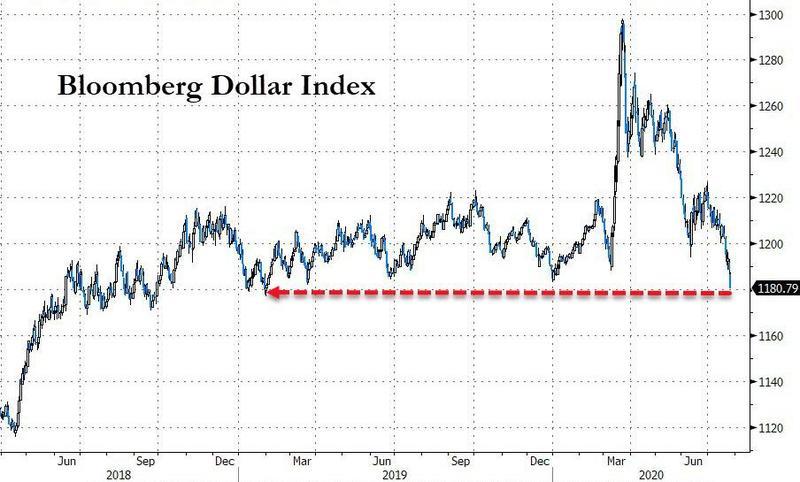
Gold’s rally continued today, as the precious metal settled at the highest price in history, namely $1,931 with silver recapturing the $24.50 level. As gold popped, the US dollar dropped, which was to be expected as these two asset classes move in opposite direction.
Equities followed gold to the upside with especially the Nasdaq regaining last week’s lost momentum by powering ahead +1.67%. Hope reigns supreme that the coronavirus rescue program by lawmakers turns out positive, and that this upcoming busiest week for the earnings season offers no unexpected surprises.
“There is a very strong case to be made for additional fiscal stimulus. Both sides of the political aisle want to get something down,” said Talley Leger, senior investment strategist for Invesco, in an interview.
He noted high-frequency data tracking movements of Americans, shopping habits and dining reservations had stalled in several states, suggesting the steady recovery in U.S. economic activity thus far was at risk of coming apart.
Today’s Durable Goods orders for June jumped 7.3%, but whether that is simply an outlier or the beginning of a new trend remains to be seen.
On deck for Tuesday and Wednesday is the Fed’s 2-day policy meeting on interest rates with no changes to be expected other than Fed head Powell maintaining his dovish views.
The big tech companies and other powerhouses will report earnings on Thursday including:
Alphabet, Amazon, Apple, Facebook, Samsung, Nestle, Procter & Gamble, Comcast, L’Oreal, Stanley Black & Decker, AstraZeneca, Linde, Mastercard, American Tower, AB InBev, Total, Volkswagen, Ford, Royal Dutch Shell, Lloyds Banking Group and Credit Suisse.
It promises to be an interesting week, possibly full of surprises.
2. ETFs in the Spotlight
In case you missed the announcement and description of this section, you can read it here again.
It features some of the 10 broadly diversified domestic and sector ETFs from my HighVolume list as posted every Saturday. Furthermore, they are screened for the lowest MaxDD% number meaning they have been showing better resistance to temporary sell offs than all others over the past year.
The below table simply demonstrates the magnitude with which these ETFs are fluctuating above or below their respective individual trend lines (%+/-M/A). A break below, represented by a negative number, shows weakness, while a break above, represented by a positive percentage, shows strength.
For hundreds of ETF choices, be sure to reference Thursday’s StatSheet.
For this current domestic “Buy” cycle, here’s how some our candidates have fared:
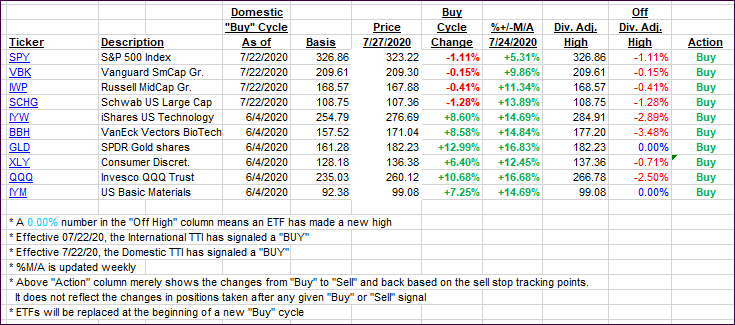
Click image to enlarge
Again, the %+/-M/A column above shows the position of the various ETFs in relation to their respective long-term trend lines, while the trailing sell stops are being tracked in the “Off High” column. The “Action” column will signal a “Sell” once the -8% point has been taken out in the “Off High” column. For more volatile sector ETFs, the trigger point is -10%.
3. Trend Tracking Indexes (TTIs)
Our TTIs regained some of their recently lost upward momentum.
This is how we closed 07/27/2020:
Domestic TTI: +3.19% above its M/A (prior close +2.78%)—Buy signal effective 07/22/2020
International TTI: +1.94% above its M/A (prior close +1.28%)—Buy signal effective 07/22/2020
Disclosure: I am obliged to inform you that I, as well as my advisory clients, own some of the ETFs listed in the above table. Furthermore, they do not represent a specific investment recommendation for you, they merely show which ETFs from the universe I track are falling within the specified guidelines.
Contact Ulli