
- Moving the markets
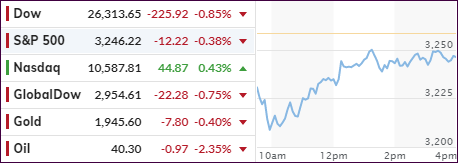
Early this morning, the Dow was down some 500 points, and other major indexes showed similar weakness, as the US economy plunged an enormous as well as unprecedented -32.9% in the second quarter confirming what I have said before: There is no V-shape recovery on the horizon. At best, we can hope for a drawn-out version.
ZH provided these details:
And while the drop – which was generally priced in – was some 5 times worse than the adjusted Q1 GDP of -6.9%, it was just fractionally better than the -34.5% expected. Then again, with a third of the US economy effectively going offline in Q2, a worse outcome than during the great depression, a few percent here and there doesn’t really matter.
The second-quarter decrease in real GDP reflected decreases in consumer spending, exports, inventory investment, business investment, and housing investment that were partially offset by an increase in government spending. Imports, a subtraction in the calculation of GDP, decreased.
That said, the biggest contributor to the overall GDP drop was the crash in consumption – the decrease in consumer spending reflected decreases in services (led by health care) and goods (led by clothing and footwear).
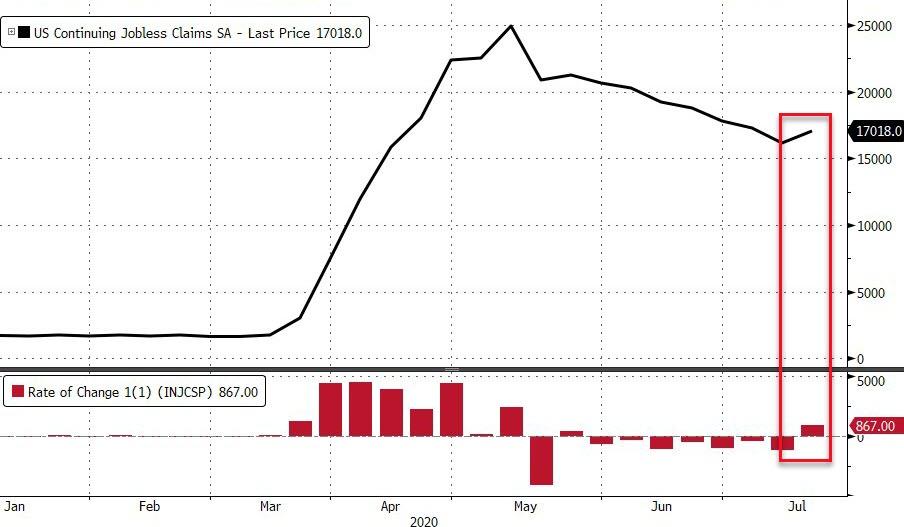
As if that was not bad enough, a rise in initial jobless claims for the second straight week indicated that economic activity has slowed down as opposed to satisfying the prospects of growth. Continuing jobless claims disappointed as well, as they rose for the first time in 8 weeks from 16.15 million to 17.02 million, according to ZH.
That means, a total of 54.13 million Americans has now applied for jobless benefits for the first time since the lockdowns began. That equates to almost 1/3 of the working population. Ouch!
The markets headed south in a hurry but managed to climb out of that initial hole and recovered most of the early losses. The Nasdaq ended up in the green by a comfortable margin, with the Dow and S&P 500 remaining in the red, as the former lagged all indexes.
In the end, the sell-off could have been far worse, so it’s now up the after-hours tech earnings to determine whether we will see red or green numbers tomorrow.
2. ETFs in the Spotlight
In case you missed the announcement and description of this section, you can read it here again.
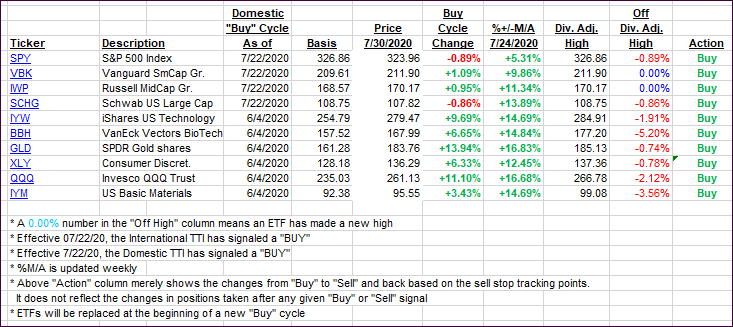
It features some of the 10 broadly diversified domestic and sector ETFs from my HighVolume list as posted every Saturday. Furthermore, they are screened for the lowest MaxDD% number meaning they have been showing better resistance to temporary sell offs than all others over the past year.
The below table simply demonstrates the magnitude with which these ETFs are fluctuating above or below their respective individual trend lines (%+/-M/A). A break below, represented by a negative number, shows weakness, while a break above, represented by a positive percentage, shows strength.
For hundreds of ETF choices, be sure to reference Thursday’s StatSheet.
For this current domestic “Buy” cycle, here’s how some our candidates have fared:
Click image to enlarge
Again, the %+/-M/A column above shows the position of the various ETFs in relation to their respective long-term trend lines, while the trailing sell stops are being tracked in the “Off High” column. The “Action” column will signal a “Sell” once the -8% point has been taken out in the “Off High” column. For more volatile sector ETFs, the trigger point is -10%.
3. Trend Tracking Indexes (TTIs)
Our TTIs reversed as poor econ data pulled two of major indexes down.
This is how we closed 07/30/2020:
Domestic TTI: +3.43% above its M/A (prior close +4.25%)—Buy signal effective 07/22/2020
International TTI: +1.22% above its M/A (prior close +2.04%)—Buy signal effective 07/22/2020
Disclosure: I am obliged to inform you that I, as well as my advisory clients, own some of the ETFs listed in the above table. Furthermore, they do not represent a specific investment recommendation for you, they merely show which ETFs from the universe I track are falling within the specified guidelines.
Contact Ulli