
ETF Tracker StatSheet
You can view the latest version here.
A VOLATILE WEEK ENDS TO THE UPSIDE
- Moving the markets
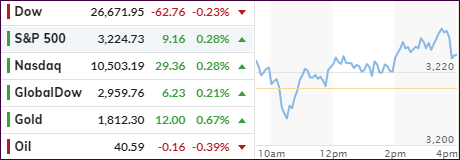
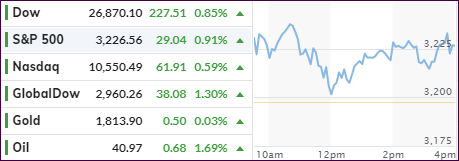
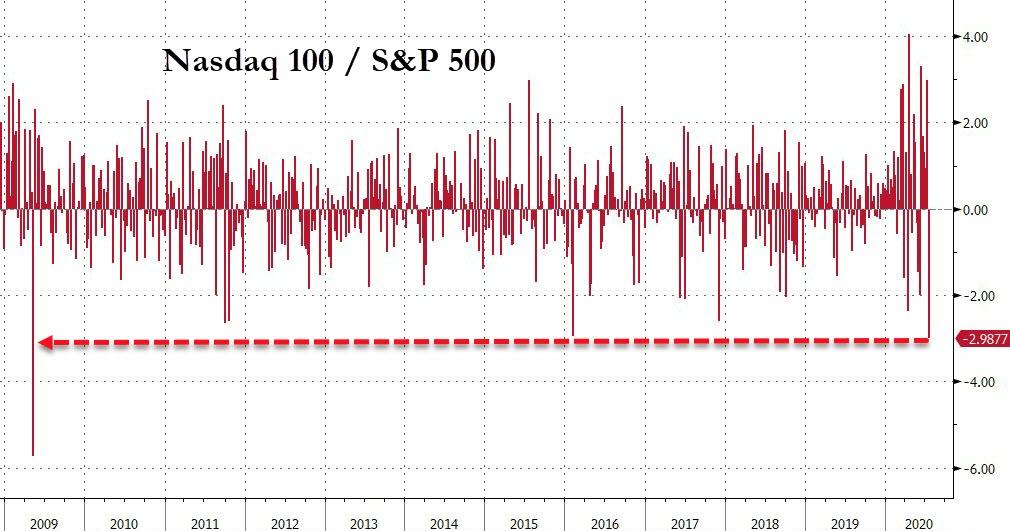
Volatility continued today, but in the end the Dow added some 2.5% for the week, the S&P 500 gained around 1%, while the Nasdaq skidded near -1.4% and suffered its worst weekly underperformance relative to the S&P 500 since 2009. This is minor when considering the Nasdaq’s YTD gain of some 22% vs. the SPY’s meager +0.99%.
The early bullish theme reversed, as the consumer sentiment index dropped to 73.2 from 78.1 vs. expectations of a rise to 78.6. Once again, the fallout from the virus continues to make itself felt, as activities are simply restricted blurring any forecasts especially those related to jobs.
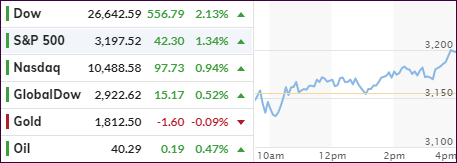
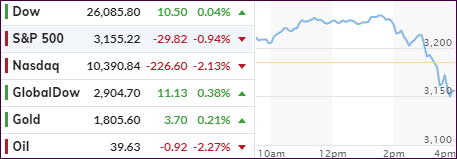
For the day, the S&P 500 and Nasdaq climbed out of an early hole, while the Dow was the laggard by closing slightly in the red. It looks to me that the rise in Covid-19 cases has limited stock advances, and has overpowered optimism for further stimulus, at least for the time being.
Of course, a sudden or unexpected fiscal stimulus announcement will likely provide the bulls with more upside momentum, and I would expect such a move, should the “one-time” $600 unemployment bonus which is due to run out by the end of July, be extended.
On deck, and possibly having a far-reaching impact, is the 2-day summit of the EU’s 27 member states, which got underway this morning in Brussels. The subject will be a controversial 750 billion Euro recovery plan, which already face heavy resistance from fiscal conservatives in the bloc.
“Presumably, as is the way of Europe, they will agree to come back from more talks followed by a compromise and a watered-down deal,” Societe Generale’s Kit Juckes said of the EU discussions. “The positive though is that we are getting a recovery fund.”
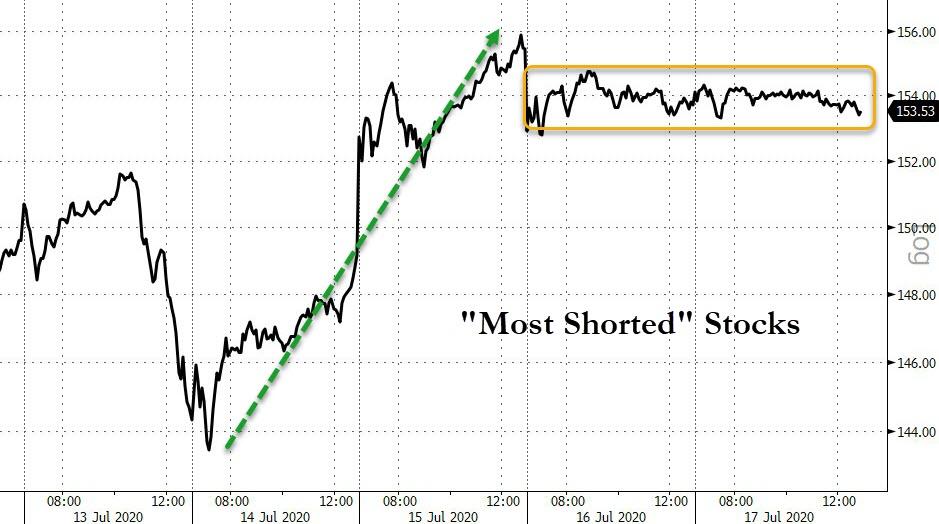
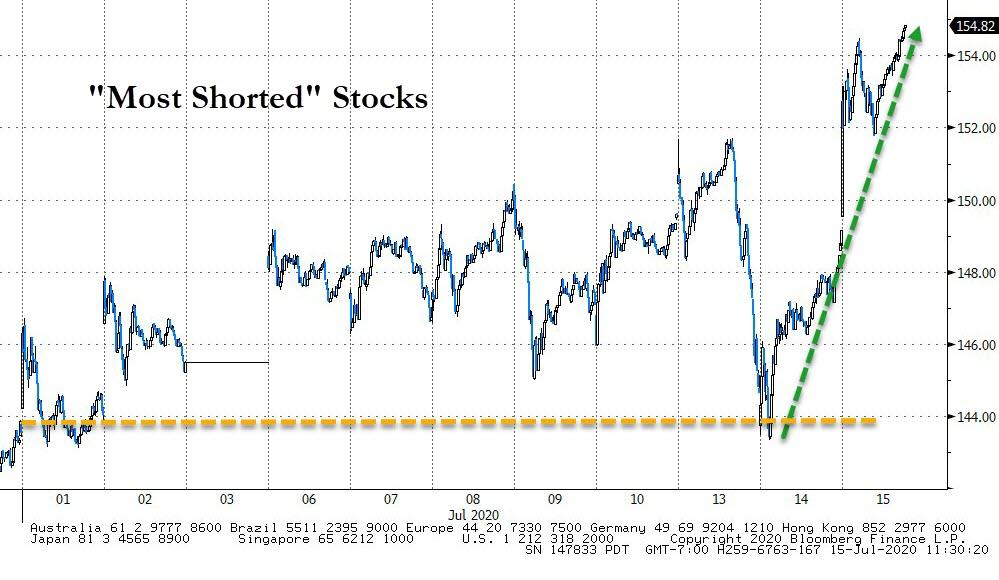
Back to the US. It’s interesting that, after being squeezed Tuesday and Wednesday, the shorts were ominously quiet, as ZH put it, and Bloomberg’s chart demonstrates. That is why the bullish moves over the past 2 days were muted and, with the Fed being quiet, caused some aimless meandering in the markets.
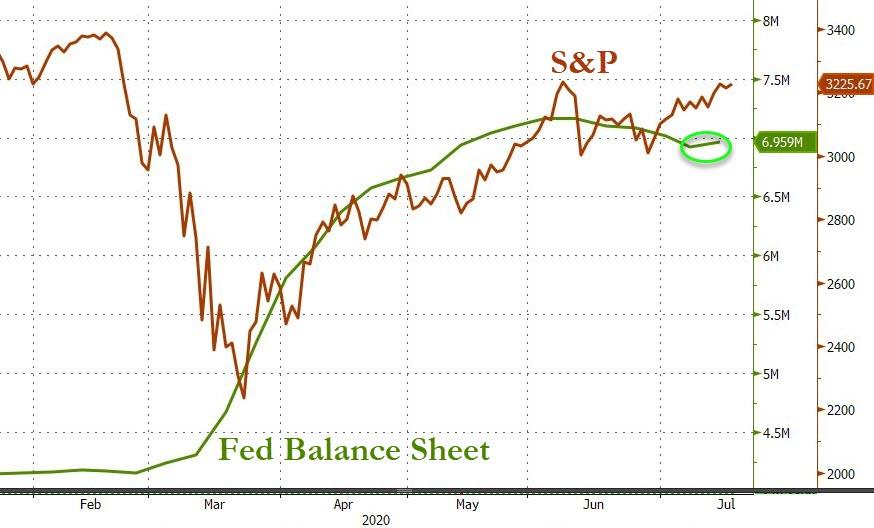
For sure, such sideways trending is bound to end, especially once the updated numbers come out again, showing that the Fed’s balance sheet has slightly reversed and is trending modestly upward again, as Bloomberg’s chart shows.
Read More