
- Moving the markets
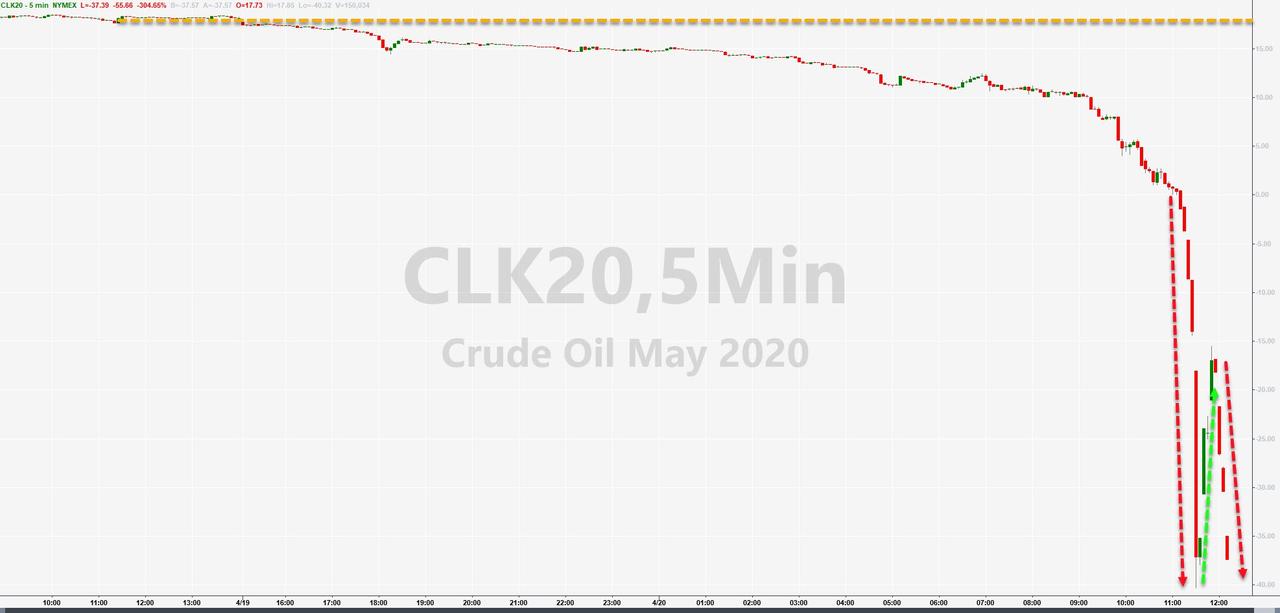
I had to look at the chart several times before realizing that May crude oil had crashed over 300%, as of this writing, into negative territory, and a barrel of WTI settled at a price of MINUS $37. In other words, a seller was willing to pay a buyer that very $37—just to take a barrel of oil off their hands!
That would be the equivalent of you buying $200 worth of groceries and at checkout, they are paying you $37 to take the groceries with you. Huh? These are some of the idiotic financial distortions we are seeing, and I am sure there is much more to come.
Of course, the reason for the oil crash is the spreading demand destruction due to the coronavirus, as the country has shut down, while land and ocean storage facilities are filled up close to their capacities.
There will be deep financial repercussions way beyond the energy sector, as banks involved in loans and derivatives are being threatened, the magnitude of which is not known at this time. However, I see it as a warning sign as to how substantial the economic fallout will be, while current stock prices are in no way reflecting these uncertainties.
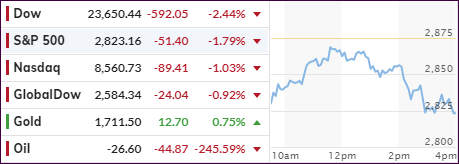
The major equity indexes had opened to the downside, but were in the process of crawling back, when the oil debacle accelerated and put an end to the mid-day rally by pushing them to new lows for the session.
Continued hope and optimism about the potential easing of the global lockdowns took a backseat to the oil crisis, but traders were on edge anyway with second wave virus infections having made a comeback.
Right now, the question in my mind is “will equities be able to resist these unprecedented events and march higher, or will we see a reversal with a re-visit of the March lows on deck?”
We will find out soon enough.
2. ETFs in the Spotlight
In case you missed the announcement and description of this section, you can read it here again.
It features some of the 10 broadly diversified domestic and sector ETFs from my HighVolume list as posted every Saturday. Furthermore, they are screened for the lowest MaxDD% number meaning they have been showing better resistance to temporary sell offs than all others over the past year.
The below table simply demonstrates the magnitude with which these ETFs are fluctuating above or below their respective individual trend lines (%+/-M/A). A break below, represented by a negative number, shows weakness, while a break above, represented by a positive percentage, shows strength.
For hundreds of ETF choices, be sure to reference Thursday’s StatSheet.
For this past domestic “Buy” cycle, which ended on 2/27/2020, here’s how some our candidates have fared:
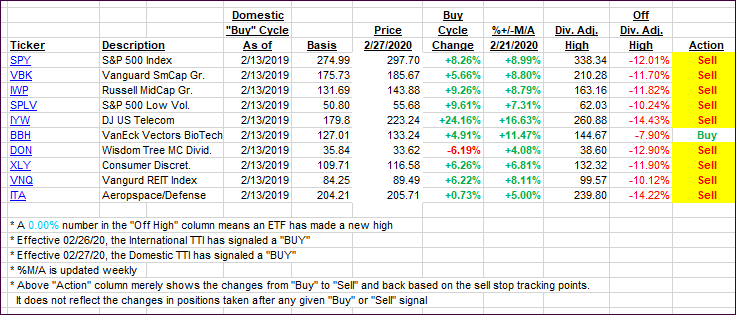
Click image to enlarge
Again, the %+/-M/A column above shows the position of the various ETFs in relation to their respective long-term trend lines, while the trailing sell stops are being tracked in the “Off High” column. The “Action” column will signal a “Sell” once the -8% point has been taken out in the “Off High” column. For more volatile sector ETFs, the trigger point is -10%.
In my advisor practice, we may or may not be invested in some of the 10 ETFs listed above.
3. Trend Tracking Indexes (TTIs)
Our TTIs improved slipped as the oil crash dominated the markets.
This is how we closed 04/20/2020:
Domestic TTI: -13.78% below its M/A (prior close -11.98%)—Sell signal effective 02/27/2020
International TTI: -14.01% below its M/A (prior close -13.23%)—Sell signal effective 02/26/2020
Disclosure: I am obliged to inform you that I, as well as my advisory clients, own some of the ETFs listed in the above table. Furthermore, they do not represent a specific investment recommendation for you, they merely show which ETFs from the universe I track are falling within the specified guidelines.
Contact Ulli