
- Moving the markets
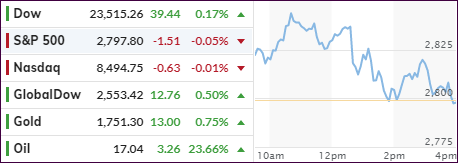
Optimists got a slap in the face, as reports of the greatly hyped experimental coronavirus drug Remdesivir, by Gilead, delivered disappointing results in clinical trials. That was enough of a downer for the markets to buckle, and the early gains were slowly wiped out, despite attempts to revive the bullish theme.
Looking at the chart above, this must have been one of the slowest days in recent weeks, with the major indexes ending the day just about unchanged.
Not helping the mood were reports from Europe, as their much-anticipated summit turned out to be a total flop with no agreement on a recovery package reached, as four “frugal” EU countries opposed any grants.
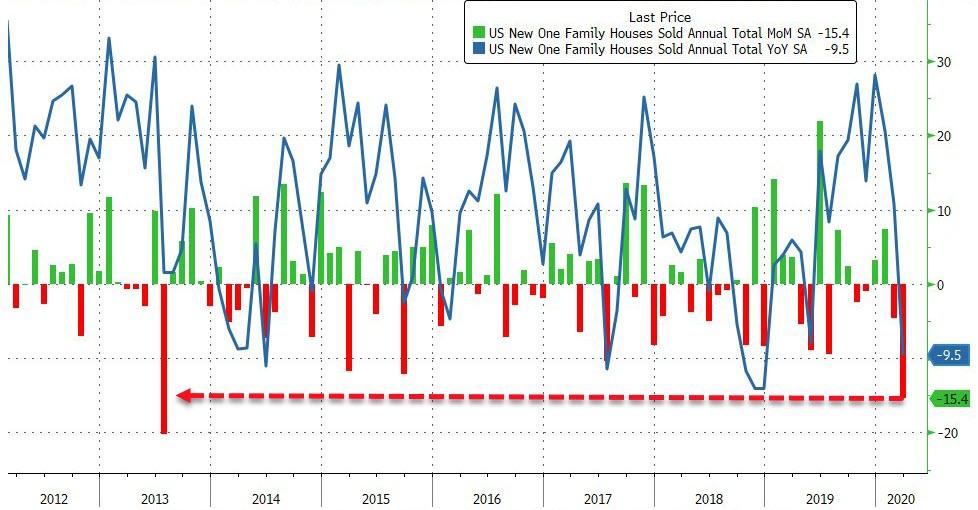
Then we learned that the housing market is not doing well, although that comes as no surprise, as New Home Sales crashed by 15.4% MoM, the biggest drop since July 2013, as ZeroHedge noted. This was also the biggest decline for March—ever!
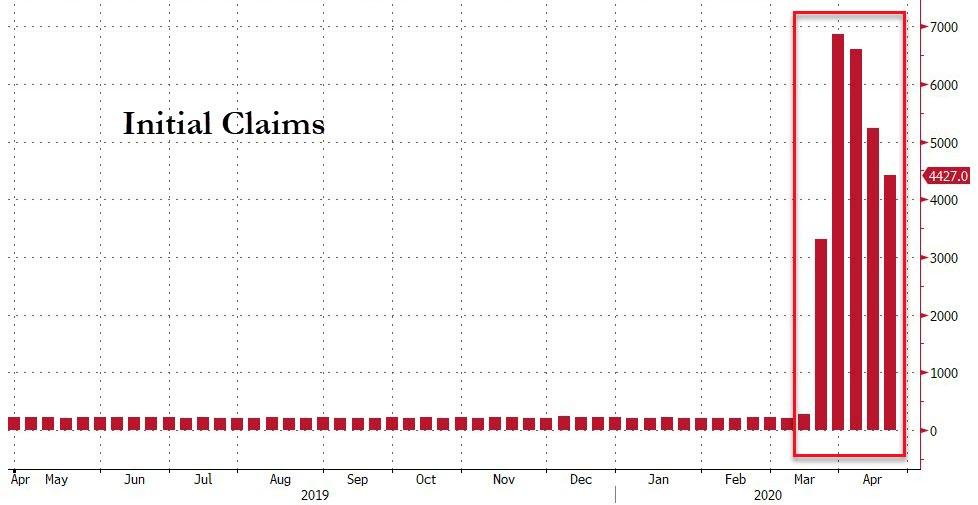
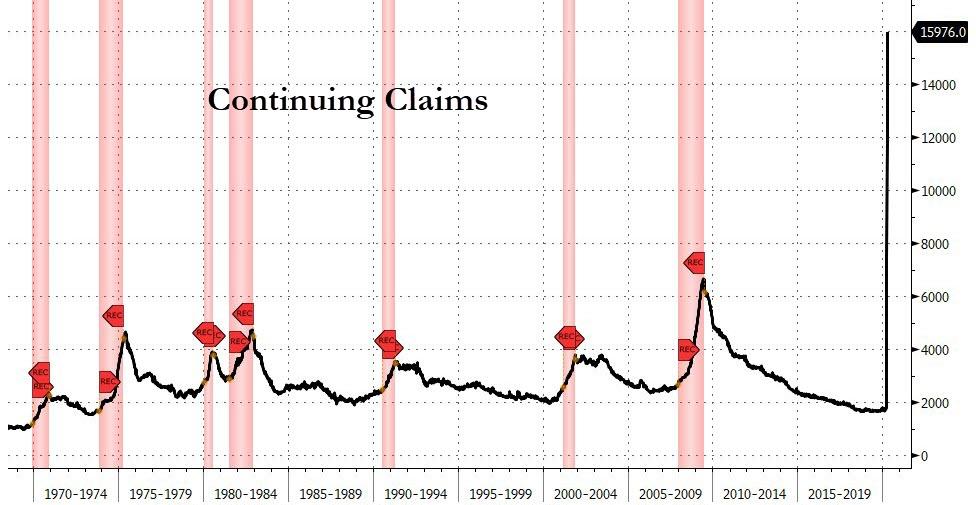
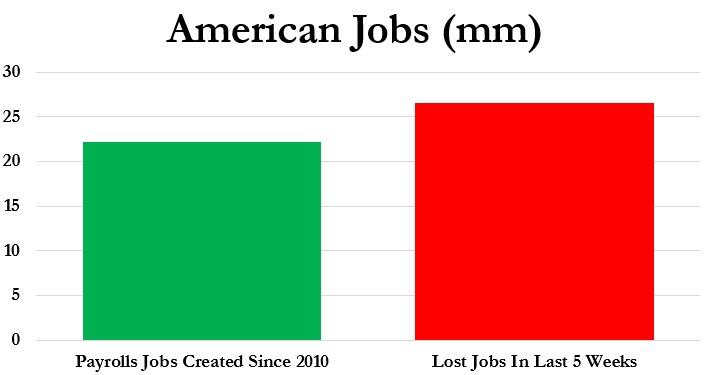
Another 4.427 million Americans filed for first time unemployment in the last week bringing the four-week claims total to 26.5 million jobs lost. If you look at the “initial” and “continuing” claims, as per Bloomberg, it shows the highest level of continuing claims ever.
That means, we have now exceeded the jobs created in the past 10 years by the number job losses in the last 5 weeks. Stunning! Yet, current market levels in no way reflect those facts but, at least for today, equities did not rally into the close.
Summing up the day using the Good, Bad and Ugly analogy was Zero Hedge:
- The Good – Stocks are up (all it took was a few trillion dollars)? Oil is up (all it took was threats of war)?
- The Bad – COVID cases are up, COVID deaths are up (and Gilead’s drug is a dud)…
- The Ugly – Over 26 million Americans have now filed for unemployment benefits in the last 5 weeks.
A three-way-standoff between ugly real economic data, ongoing global lockdowns, and the Fed’s “whatever it takes” asset lift-a-thon…
What’s next? Will more bad news be good news again?
2. ETFs in the Spotlight
In case you missed the announcement and description of this section, you can read it here again.
It features some of the 10 broadly diversified domestic and sector ETFs from my HighVolume list as posted every Saturday. Furthermore, they are screened for the lowest MaxDD% number meaning they have been showing better resistance to temporary sell offs than all others over the past year.
The below table simply demonstrates the magnitude with which these ETFs are fluctuating above or below their respective individual trend lines (%+/-M/A). A break below, represented by a negative number, shows weakness, while a break above, represented by a positive percentage, shows strength.
For hundreds of ETF choices, be sure to reference Thursday’s StatSheet.
For this past domestic “Buy” cycle, which ended on 2/27/2020, here’s how some our candidates have fared:
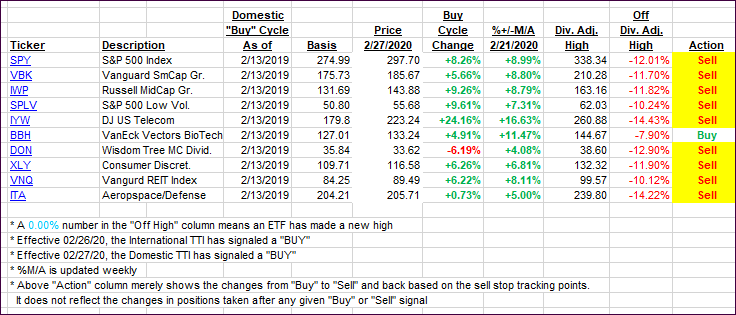
Click image to enlarge
Again, the %+/-M/A column above shows the position of the various ETFs in relation to their respective long-term trend lines, while the trailing sell stops are being tracked in the “Off High” column. The “Action” column will signal a “Sell” once the -8% point has been taken out in the “Off High” column. For more volatile sector ETFs, the trigger point is -10%.
In my advisor practice, we may or may not be invested in some of the 10 ETFs listed above.
3. Trend Tracking Indexes (TTIs)
Our TTIs barely changed, as an initial pump faded and left the major indexes just about unchanged.
This is how we closed 04/23/2020:
Domestic TTI: -14.65% below its M/A (prior close -14.73%)—Sell signal effective 02/27/2020
International TTI: -15.04% below its M/A (prior close -15.47%)—Sell signal effective 02/26/2020
Disclosure: I am obliged to inform you that I, as well as my advisory clients, own some of the ETFs listed in the above table. Furthermore, they do not represent a specific investment recommendation for you, they merely show which ETFs from the universe I track are falling within the specified guidelines.
Contact Ulli