
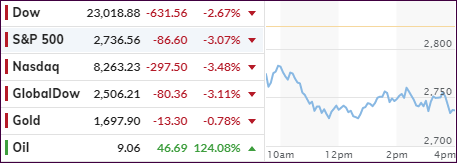
After yesterday’s historic crash in oil prices, which pulled down equities as well, the pain did not stop today, as the major indexes got clobbered again with the S&P 500 surrendering over 3%.
Apparently, even the headline scanning computer algos were confused as oil prices recovered some, but remain crushed, while earnings reports and additional congressional aid for businesses were not offering any clear path to a recovery.
At the same time, worries about further fallout from the energy sector via defaults and layoffs has created an environment undermining risk sentiment, the true extent of which will be unknown for a while. As a result, the more volatile tech sector fared the worst with the Nasdaq sinking almost -3.5%.
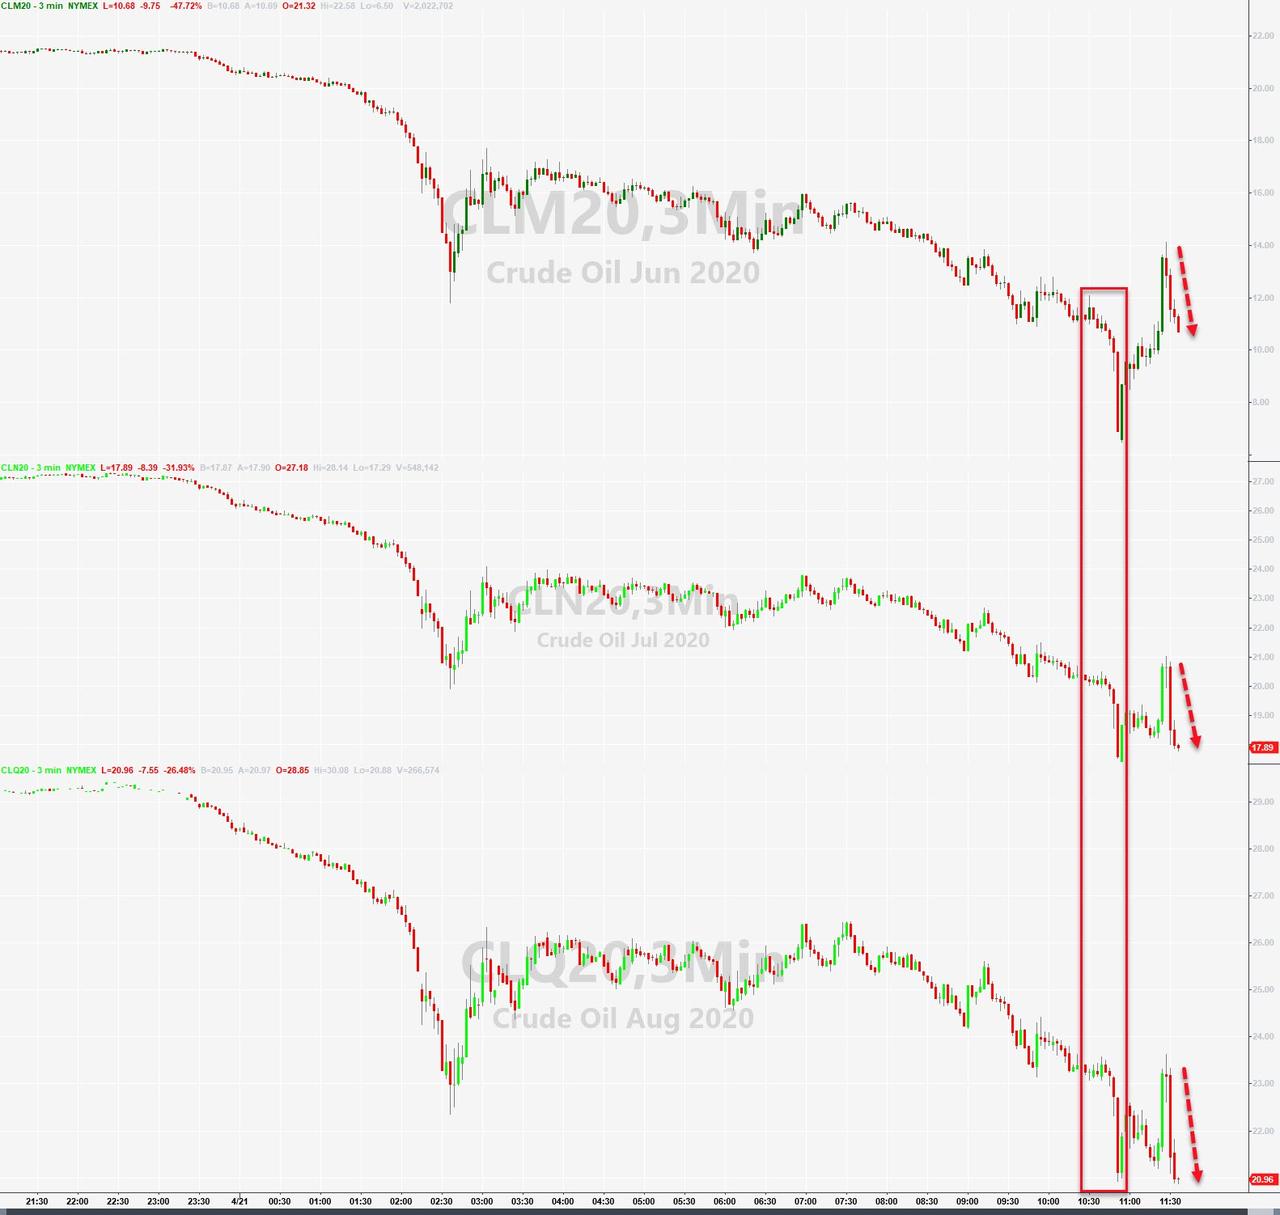
Back to the oil saga. With May’s contract expired, the focus was on June, which also got hammered and marked its lowest finish in 21 years by settling at $11.57/barrel. Again, the issue is one of demand destruction and oversupply, which means in about 6 weeks all storage facilities will have been filled up, unless the economy starts roaring back—and does so quickly.
While this is possible, it is not very likely due to the State restrictions and various phase-in procedures to reopen the country, so I think we will see many more tumultuous events from the energy sector. That may even accelerate, once it becomes clear which entities have collapsed and are no longer viable businesses.
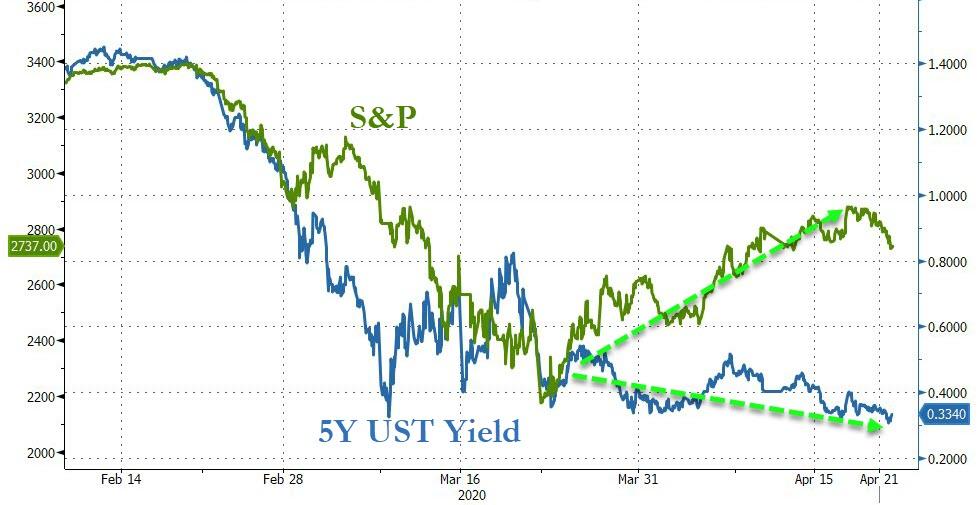
In bond land, the 5-year hit a new record low intraday, according to ZeroHedge, which highlights the decoupling between the bond market and the stock market’s rebound, as Bloomberg shows in this chart. If, as is usually the case, bonds are correct that would mean that the S&P 500 would have to retract to a level around the 2,100, which would represent a drop of some -23%.
Should that materialize, we will have taken out the March lows (2,191), and a clear resumption of the bear market would be a foregone conclusion.
2. ETFs in the Spotlight
In case you missed the announcement and description of this section, you can read it here again.
It features some of the 10 broadly diversified domestic and sector ETFs from my HighVolume list as posted every Saturday. Furthermore, they are screened for the lowest MaxDD% number meaning they have been showing better resistance to temporary sell offs than all others over the past year.
The below table simply demonstrates the magnitude with which these ETFs are fluctuating above or below their respective individual trend lines (%+/-M/A). A break below, represented by a negative number, shows weakness, while a break above, represented by a positive percentage, shows strength.
For hundreds of ETF choices, be sure to reference Thursday’s StatSheet.
For this past domestic “Buy” cycle, which ended on 2/27/2020, here’s how some our candidates have fared:
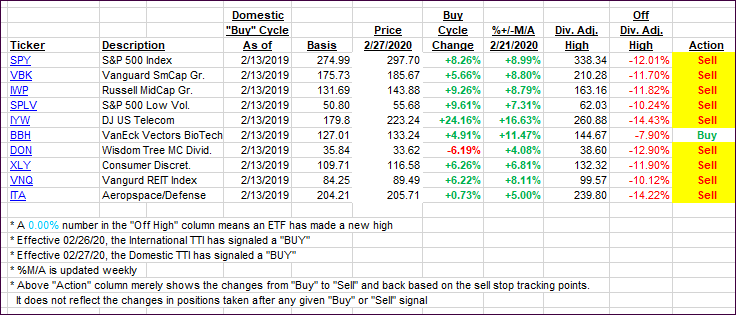
Click image to enlarge
Again, the %+/-M/A column above shows the position of the various ETFs in relation to their respective long-term trend lines, while the trailing sell stops are being tracked in the “Off High” column. The “Action” column will signal a “Sell” once the -8% point has been taken out in the “Off High” column. For more volatile sector ETFs, the trigger point is -10%.
In my advisor practice, we may or may not be invested in some of the 10 ETFs listed above.
3. Trend Tracking Indexes (TTIs)
Our TTIs headed south as equities got slammed for the second consecutive day.
This is how we closed 04/21/2020:
Domestic TTI: -16.30% below its M/A (prior close -13.78%)—Sell signal effective 02/27/2020
International TTI: -16.60% below its M/A (prior close -14.01%)—Sell signal effective 02/26/2020
Disclosure: I am obliged to inform you that I, as well as my advisory clients, own some of the ETFs listed in the above table. Furthermore, they do not represent a specific investment recommendation for you, they merely show which ETFs from the universe I track are falling within the specified guidelines.
Contact Ulli