Below, please find the latest High-Volume ETF Cutline report, which shows how far above or below their respective long-term trend lines (39-week SMA) my currently tracked ETFs are positioned.
This report covers the HV ETF Master List from Thursday’s StatSheet and includes 312 High Volume ETFs, defined as those with an average daily volume of more than $5 million, of which currently 148 (last week 138) are hovering in bullish territory. The yellow line separates those ETFs that are positioned above their trend line (%M/A) from those that have dropped below it.
In case you are not familiar with some of the terminology used in the reports, please read the Glossary of Terms. If you missed the original post about the Cutline approach, you can read it here..
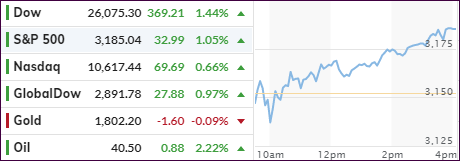
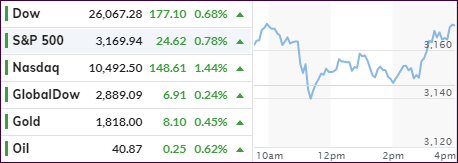
This morning we saw something highly unusual in the markets, namely that the Dow and S&P quickly stormed out of an early hole, with the Nasdaq lagging, something we have not seen in a while. However, when looking at the bigger picture, the tech sector index has been up 8 of the last 9 days and 17 of the last 20 days.
All 3 major indexes closed solidly in the green, but tech simply could not outshine the others today but nevertheless closed on the plus side of its unchanged line.
Despite the US seeing a record number of new Covid-19 infections, and some hospitals in California, Texas and other States reporting rising hospitalizations, traders remained unrattled and kept their focus on potential treatments.
Even the realities of the enormous June budget deficit elicited nothing more than a yawn from Wall Street, with MN Gordon from the EconomicPrism.com adding these comments:
The realities of the madness are too awful for most journalists to offer any real deep analysis. The U.S. budget deficit in June was $863 billion. For perspective, an annual budget deficit of $863 billion is enormously massive and fiscally unsustainable. Yet, now, the U.S. government has racked up $863 billion in debt, in just one month.
For additional perspective, the budget deficit for June 2019 was $8 billion. Hence, the deficit for June 2020 has increased 101x compared to June of last year. This, no doubt, is game overspending; desperate actions by a desperate government to keep this sucker from going down.
For sure, this may not be a problem right now, but it eventually will lead to an erosion of the dollar’s purchasing power, which is why I continue harping on the theme that anyone should own some gold to protect their assets against future dire consequences, namely inflation.
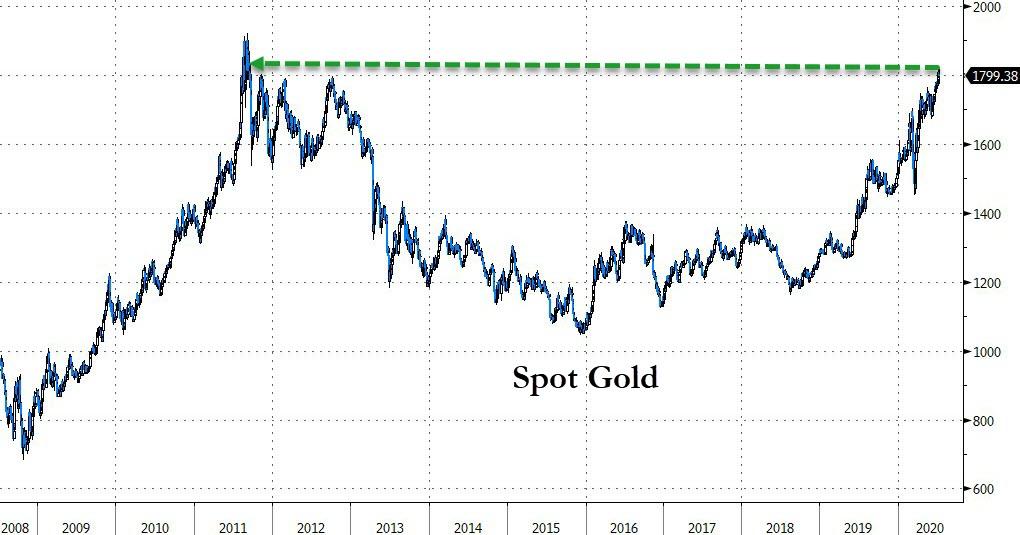
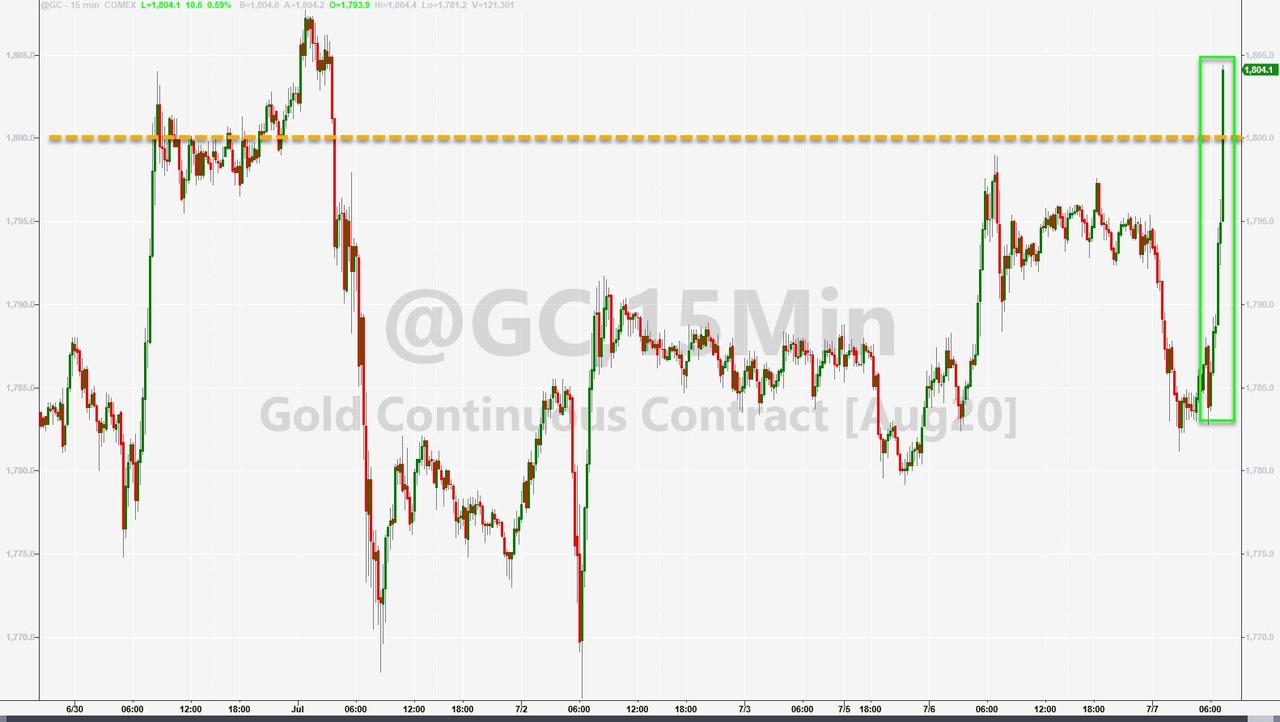
Despite giving back a little today, gold has been hanging on to its $1,800 level with spot gold having reached its highest point since 2011, as Bloomberg’s chart shows.
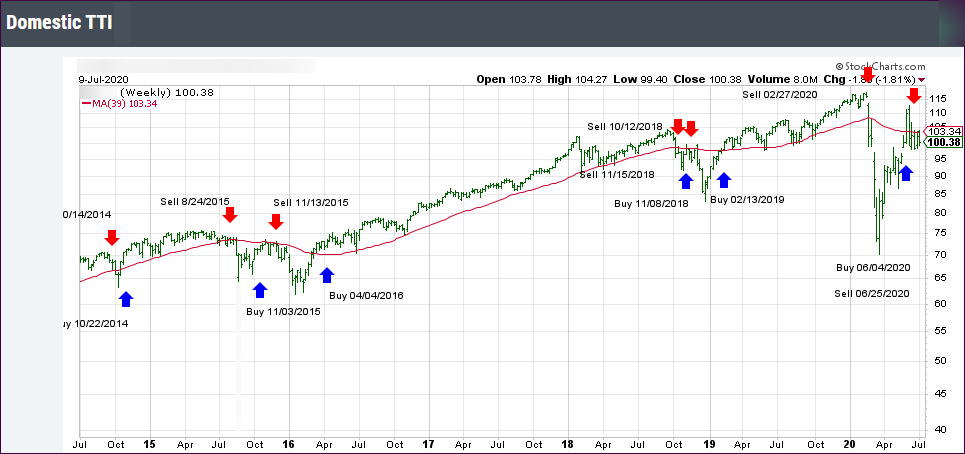
Our Trend Tracking Indexes (TTIs) made up some lost ground today, but still have not been able to conquer their respective trend lines. One of the reasons is that the TTIs are broad-based indicators, while the rebound of the past has been narrowly defined to only a few stocks, with all of them being part of the Nasdaq, hence the superiority of the tech sector.
1. From the universe of over 1,800 ETFs, I have selected only those with a trading volume of over $5 million per day (HV ETFs), so that liquidity and a small bid/ask spread are assured.
2. Trend Tracking Indexes (TTIs)
Buy or Sell decisions for Domestic and International ETFs (section 1 and 2), are made based on the respective TTI and its position either above or below its long-term M/A (Moving Average). A crossing of the trend line from below accompanied by some staying power above constitutes a “Buy” signal. Conversely, a clear break below the line constitutes a “Sell” signal. Additionally, I use a 7.5% trailing stop loss on all positions in these categories to control downside risk.
3. All other investment arenas do not have a TTI and should be traded based on the position of the individual ETF relative to its own respective trend line (%M/A). That’s why those signals are referred to as a “Selective Buy.” In other words, if an ETF crosses its own trendline to the upside, a “Buy” signal is generated. Since these areas tend to be more volatile, I recommend a wider trailing sell stop of 7.5% -10% depending on your risk tolerance.
If you are unfamiliar with some of the terminology, please see Glossary of Termsand new subscriber information in section 9.
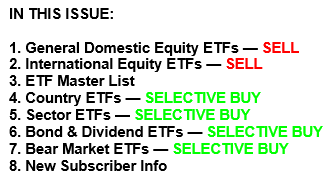
1. DOMESTIC EQUITY ETFs: SELL — since 06/25/2020
Click on chart to enlarge
Our main directional indicator, the Domestic Trend Tracking Index (TTI-green line in the above chart) has now dropped below its long-term trend line (red) by -2.98% and has generated a new Domestic “Sell” signal effective 06/25/20 as posted.
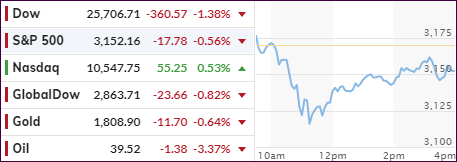
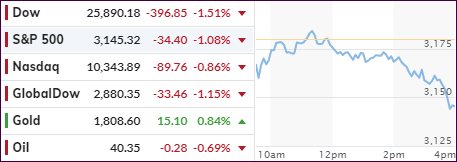
An early bump in the tech sector gave way to selling, as the bears took charge of today’s session early on. Increasing coronavirus cases in Florida, Texas and California added to Wall Street’s woes with even the Nasdaq temporarily succumbing to red numbers, albeit at a lesser degree than the other major indexes.
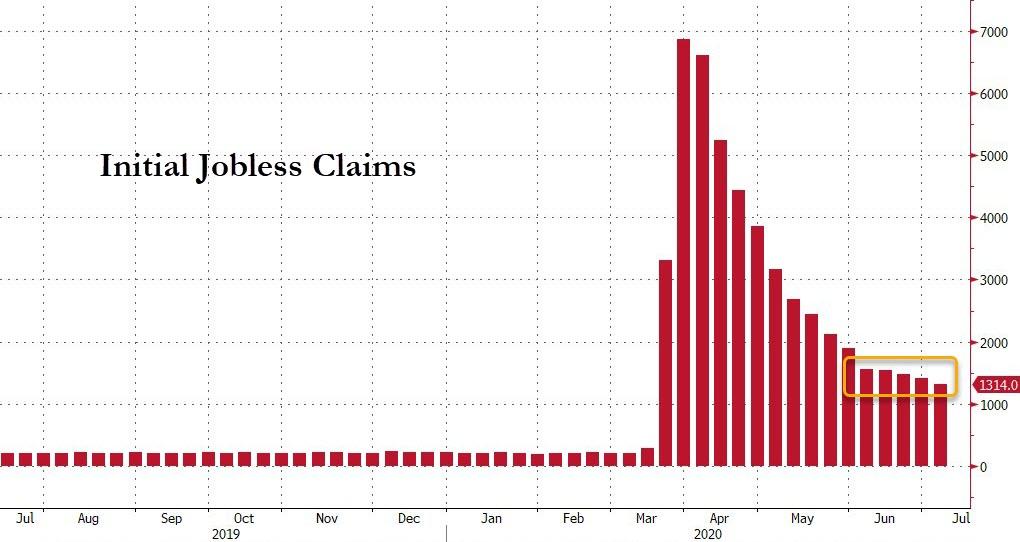
Almost 50 million Americans have now filed for first-time jobless benefits since the beginning of the lockdown, according to ZH. This week, we saw initial claims of 1.314 million, a slightly better number than the 1.375 million expected.
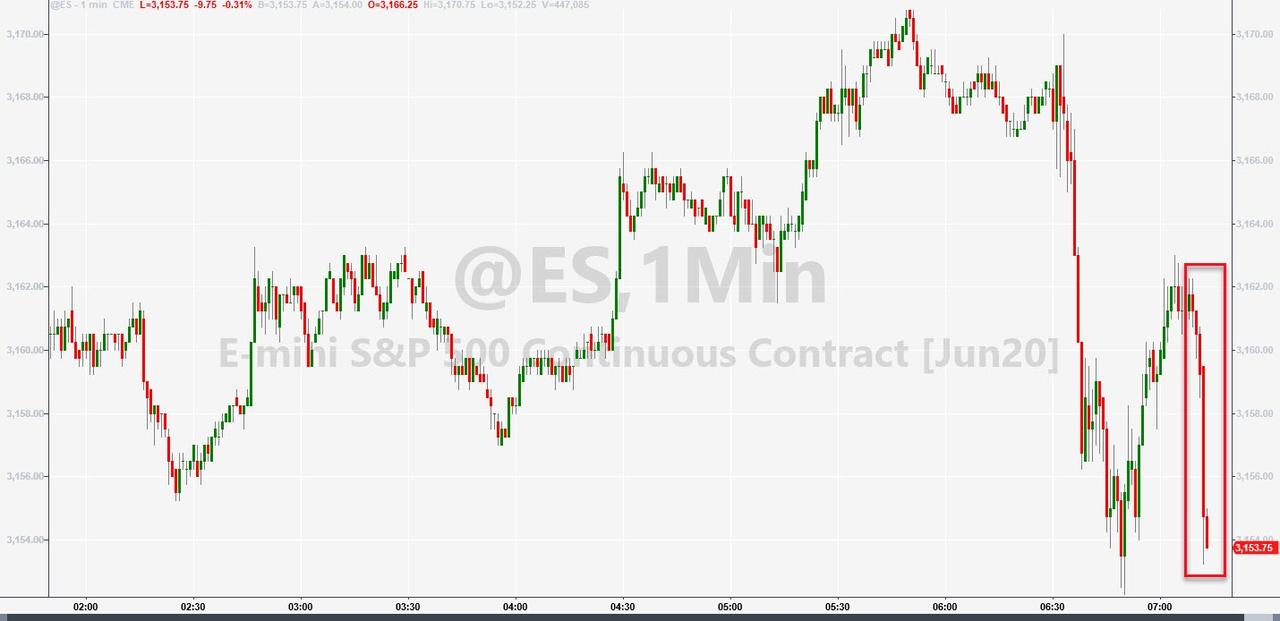
Taking the starch out of the early bump, and dropping stocks suddenly, was news of the SCOTUS Trump decision that a NY Grand Jury can get access to Trump’s tax returns, prompting ZH to comment:
This sparked instant selling pressure on the market, as it seems investors may have suddenly come to the realization that Biden could win (and Dems take the Senate) sending the S&P into the red…
It seems the market cares about a Trump presidency after all…
In the end, the Nasdaq managed to crawl back into green, despite late news that Joe Biden wants to raise the corporate tax rate to 28%, while the Dow and S&P closed in the red, with the former taking the bigger beating.
I have some business commitments now, so this post will be a short one, but I will update the TTIs and the Spotlight table later this afternoon.
Another roller coaster day saw the major indexes fluctuate wildly with an initial rally being wiped out, which pushed the Dow and S&P 500 briefly in the red. The Nasdaq managed to stay in the green and then ripped to new intra-day highs late in the session, as all indexes joined in the bounce-back.
In the end, the Nasdaq again dominated the scene and produced another superb +1.44% gain, as we have seen all year long. The Dow and the S&P ended up only moderately higher.
Again, yesterday’s question as whether the unabated increases in Covid-19 cases in several states will delay a V-shape recovery continued to be the center of discussion. I believe it will, but another widely overlooked reason surfaced today.
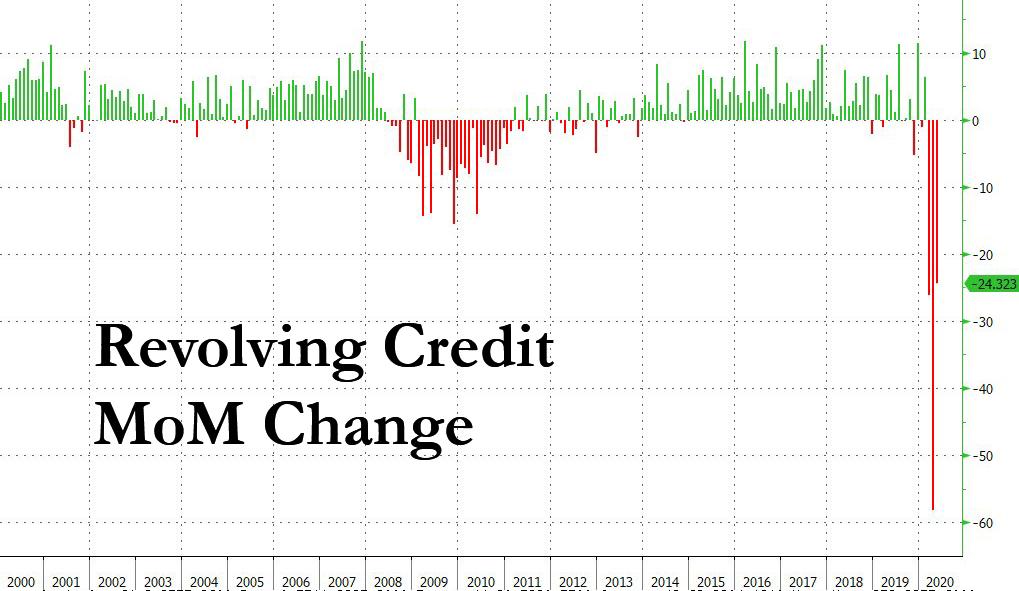
ZH reported that the plunge in consumer credit continued as Americans repaid record amounts of credit card debt:
What we find most surprising, however, is that in this day and age when the Fed has effectively institutionalized moral hazard and where failure is no longer punished as capitalism is now officially dead and zombie existence is rewarded, Americans still care enough about their credit rating to pay down their own debt even as corporations and the country go on a historic debt issuance spree which everyone knows will never be repaid.
So how long until this shocking plunge in consumer spending reverses? The answer is that nobody knows, but until US consumers feel comfortable enough to once again “charge it”, there can be no recovery.
With 70% of the GDP being derived from consumer spending, a “true” organic recovery will not be in the cards until that sentiment changes again.
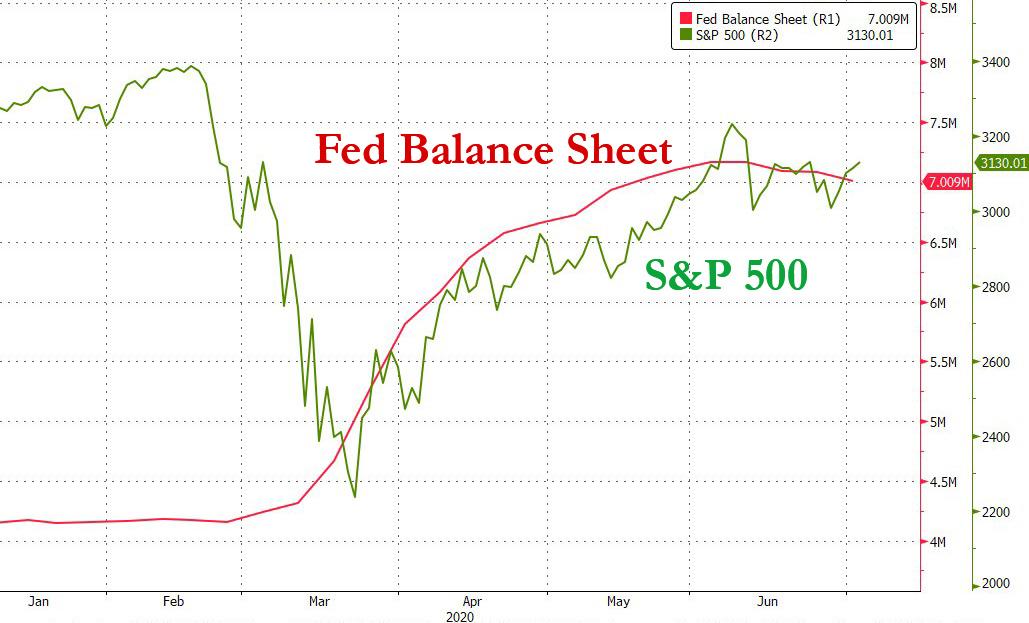
Regarding the markets, we must rely on the Fed’s expansion of its balance sheet to see further advances. As this chart shows, the flattening out in that very balance sheet has had the markets trading in a tight range since the early June highs.
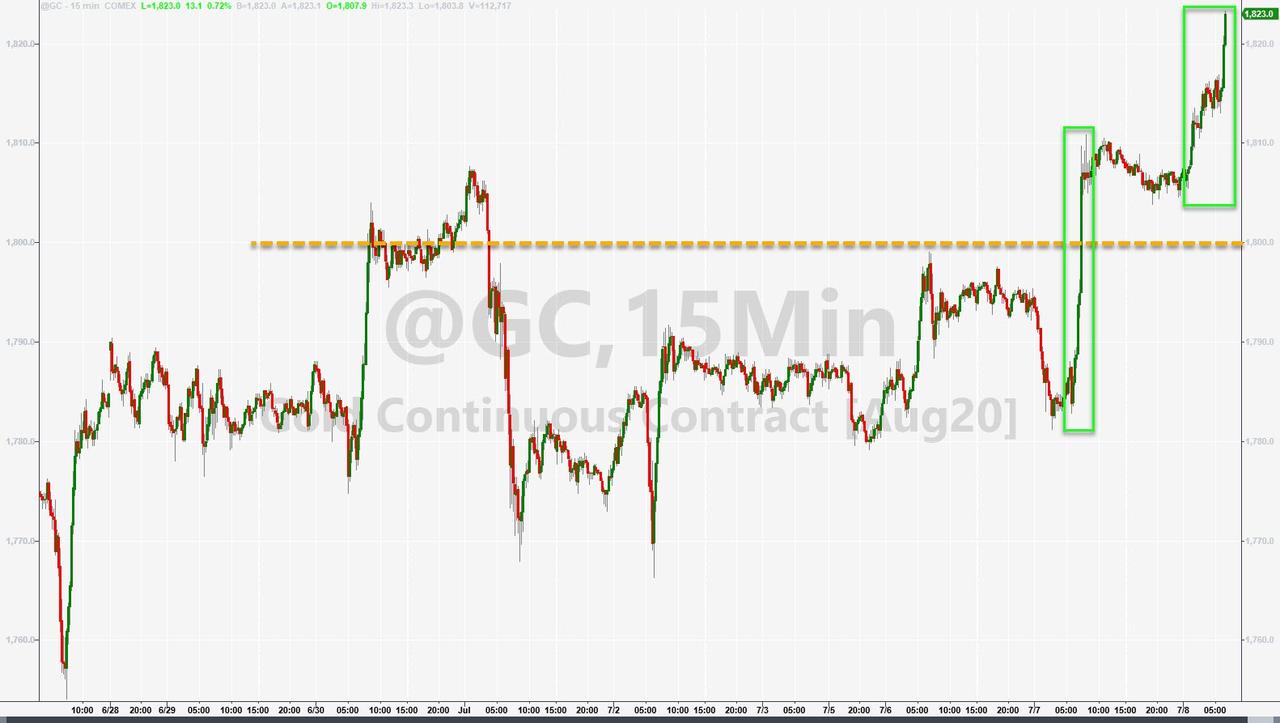
Be that as it may, gold has been moving relentlessly higher and even its spot price has topped $1,800 for the first time since November of 2011, according to ZH.
Given the ever-increasing money printing efforts, which will lead to an increase of inflation and a decrease of the dollar’s purchasing power, gold should be an essential part in everyone’s portfolio.
An early one-sided rally, dominated by the Nasdaq, lost momentum with all 3 major indexes hitting the skids and closing lower. The Nasdaq held up the best, while the Dow fared the harshest, but all closed at their worst levels of the session.
Saving the day was gold, which not only reclaimed its $1,800 level but also managed to solidly close above it thereby minimizing today’s modest fall of the tech sector. With the Fed’s reckless money printing continuing unabated, it’s only a matter of time before inflation rears its ugly head, while concurrently future monetary interventions may be of questionable value.
As Ron Paul recently wrote, with lending facilities providing to the Federal Reserve the ability to give money directly to businesses and governments, the Fed is now just one step away from implementing Ben Bernanke’s infamous suggestion that, if all else fails, the Fed can drop money from a helicopter. These interventions will not save the economy. Instead, they will make the inevitable crash more painful.
The next crash can bring about the end of the fiat monetary system. The question is not if the current monetary system ends, but when. The only way Congress can avoid the Fed causing another great depression is to begin transitioning to a free-market monetary system by auditing, then ending, the Fed.
While that does not mean the rally won’t continue, other concerns, like rising coronavirus infections, can dampen the buying mood on Wall Street, which was the case today. On the other hand, with the markets having been on a tear lately, a breather was necessary, and Covid-19 provided just such an excuse.
Be that as it may, with equities being totally depended on liquidity created by the Fed, anything is possible and can happen regarding market direction. It’s therefore imperative that you have an exit strategy in place to protect your portfolio from extreme downside risk.
