
Snapping A 2-Day Slide
- Moving the markets
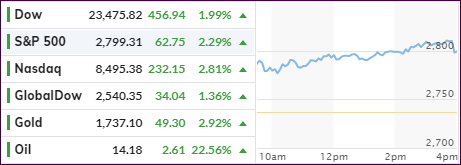
After a 2-day slide, the markets found some footing via temporary
stabilization of the oil market, some better-than-expected earnings reports,
and anticipation that Congress will produce another stimulus package, maybe
this time without much bickering.
Getting things started, and preventing oil from slipping further, were announcements by the administration to shoot at Iranian gunboats should they interfere again with U.S. Navy operations in open waters.
A little saber rattling like this had the desired effect and put oil prices back on a northerly path, at least for the time being. However, troubles in that sector are sure to continue next month at the expiration of June futures.
In terms of market direction, plenty of opposing views exist with 2 big boys now engaged in a tug-of-war. On one side, we have JPM’s math whiz Marko Kolanovic, who is favoring new market highs by 2021, and that in the face of plunging earnings expectations of 30% or more. On the other side, we have billionaire investor Paul Singer, who noted that “our gut tells us that a 50% or deeper decline from the February top might be the ultimate path of global stock markets.”
I tend to lean more towards Paul’s assessment with the recent rebound off the lows being reviewed by Citi’s Robert Buckland like this:
“All bear markets include false rallies, often associated with supportive monetary policy. But markets only find a sustainable base when there are signs that cheap money is feeding through into the real economy, rather than temporarily supporting asset prices.”
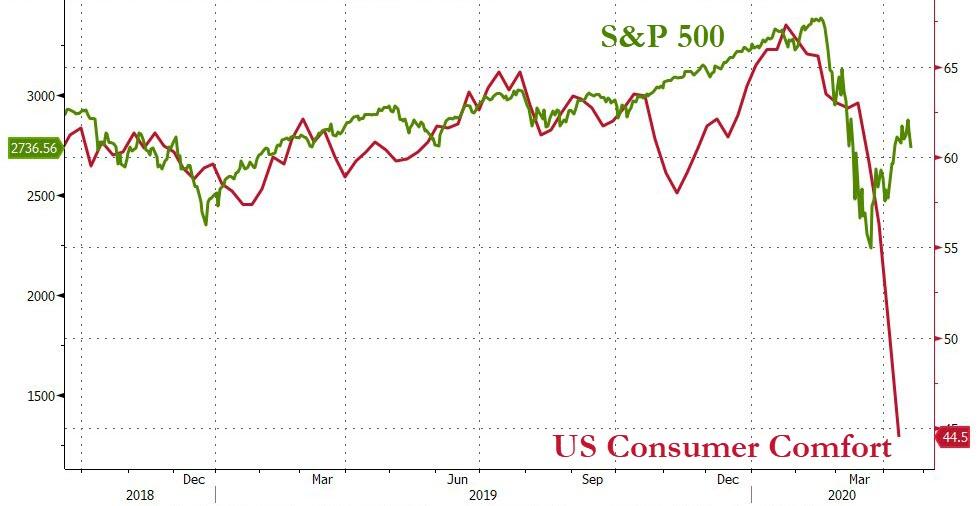
Most economic numbers are so bad that I don’t need to regurgitate them, but I found it interesting, yet not surprising, that the US Consumer Comfort signaled an environment that clearly demonstrates an obvious divergence from Wall Street to Main Street.
2. ETFs in the Spotlight
In case you missed the announcement and description of this section, you can read it here again.
It features some of the 10 broadly diversified domestic and sector ETFs from my HighVolume list as posted every Saturday. Furthermore, they are screened for the lowest MaxDD% number meaning they have been showing better resistance to temporary sell offs than all others over the past year.
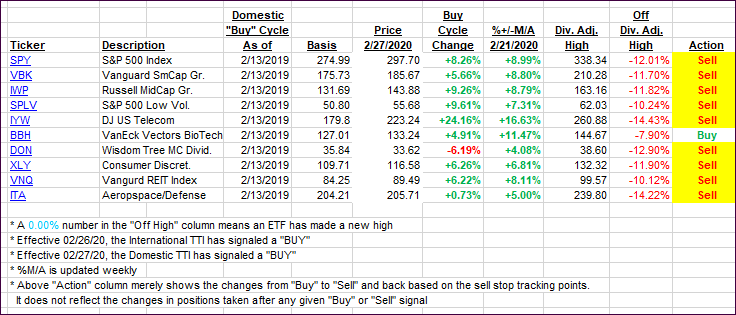
The below table simply demonstrates the magnitude with which these ETFs are fluctuating above or below their respective individual trend lines (%+/-M/A). A break below, represented by a negative number, shows weakness, while a break above, represented by a positive percentage, shows strength.
For hundreds of ETF choices, be sure to reference Thursday’s StatSheet.
For this past domestic “Buy” cycle, which ended on 2/27/2020, here’s how some our candidates have fared:
Click image to enlarge
Again, the %+/-M/A column above shows the position of the various ETFs in relation to their respective long-term trend lines, while the trailing sell stops are being tracked in the “Off High” column. The “Action” column will signal a “Sell” once the -8% point has been taken out in the “Off High” column. For more volatile sector ETFs, the trigger point is -10%.
In my advisor practice, we may or may not be invested in some of the 10 ETFs listed above.
3. Trend Tracking Indexes (TTIs)
Our TTIs recovered as equities and oil managed a rebound after 2 days of losses.
This is how we closed 04/22/2020:
Domestic TTI: -14.73% below its M/A (prior close -16.30%)—Sell signal effective 02/27/2020
International TTI: -15.47% below its M/A (prior close -16.60%)—Sell signal effective 02/26/2020
Disclosure: I am obliged to inform you that I, as well as my advisory clients, own some of the ETFs listed in the above table. Furthermore, they do not represent a specific investment recommendation for you, they merely show which ETFs from the universe I track are falling within the specified guidelines.
Contact Ulli