ETF Tracker Newsletter For June 4, 2021

Ulli ETF Tracker Contact

ETF Tracker StatSheet          

You can view the latest version here.

WHEN BAD NEWS IS GOOD NEWS
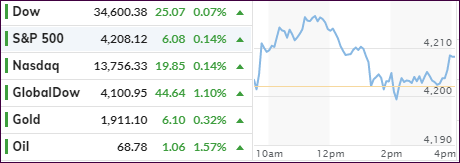
[Chart courtesy of MarketWatch.com]

  1. Moving the markets

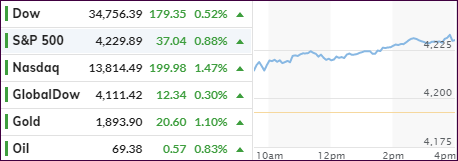
The eagerly awaited May jobs report surprised us with another “miss,” but it was not as dreadful as April’s result. The BLS reported that 559k jobs were added, which was a big improvement from last month’s revised 278k, but it fell short of expectations of 671k.

Traders interpreted this reading as a “goldilocks” scenario, meaning that the number was not “hot” enough to cause Fed intervention, yet good enough to not have to worry about the economy. As a result, the bulls got their way, and up we went.

The three major indexes scored solid gains, for a change led by the lagging Nasdaq, which notched a 1.47% advance. Today, it was a victory for “growth” over “value” with Small Caps (VBK) adding 1.01%.

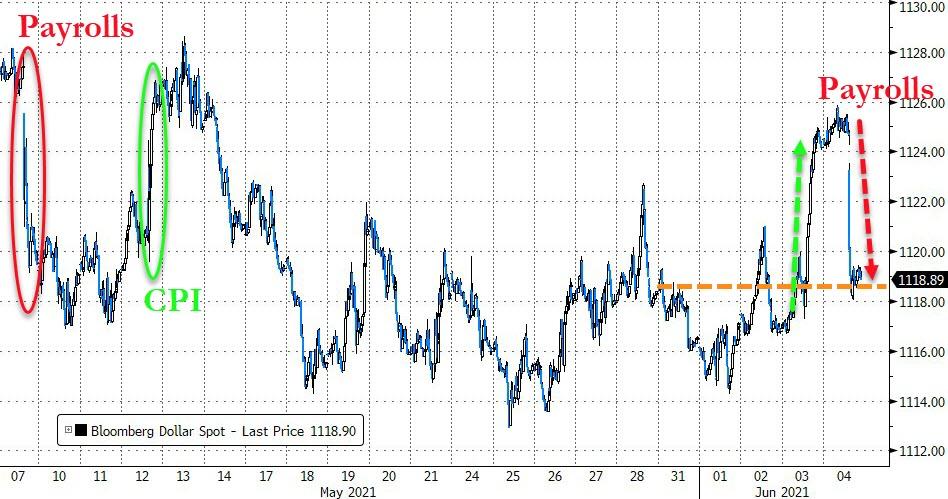
Bond yields took a big tumble with the 10-year dropping below the 1.56% level, its second lowest yield since early March, as ZeroHedge pointed out. After yesterday’s spike, the US Dollar was beaten back down to reality and plunged sharply.

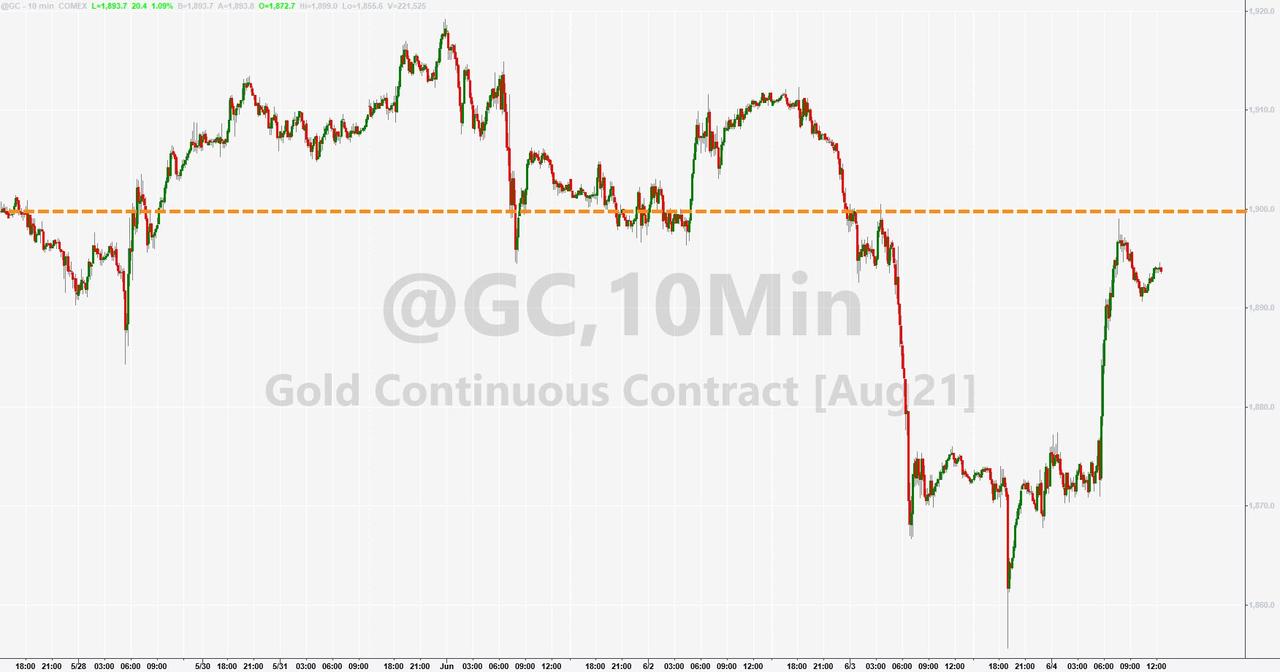
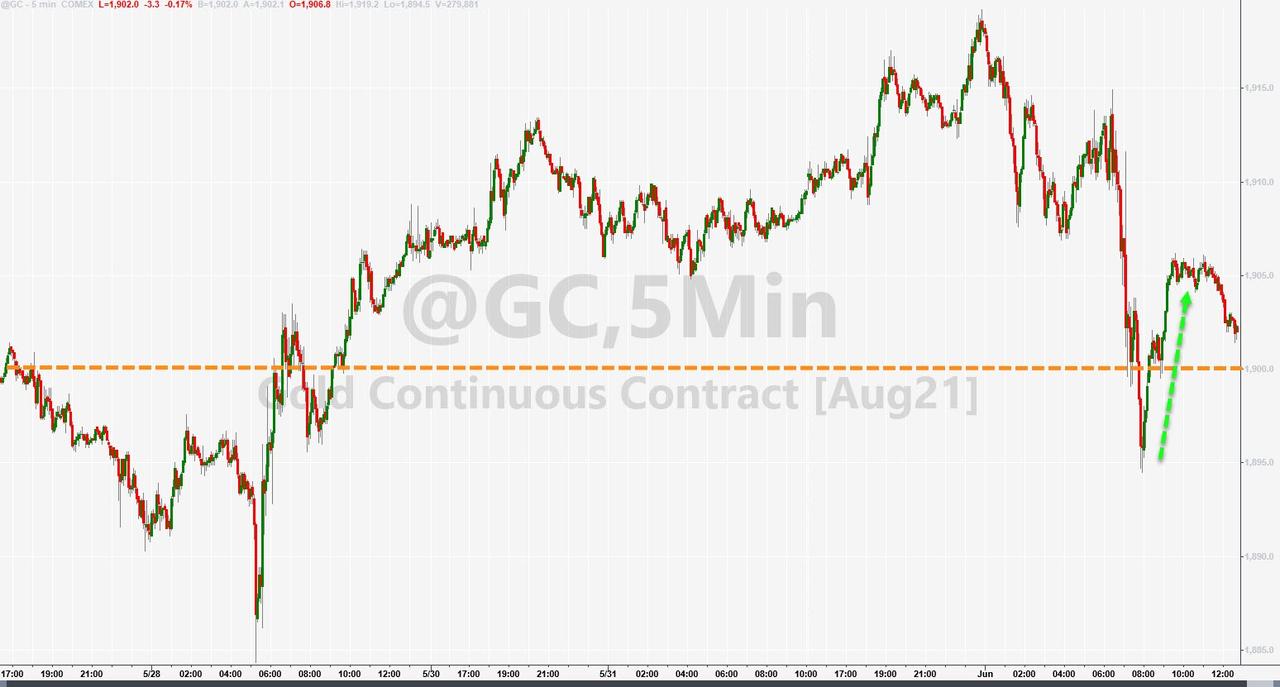
This combination of a falling dollar and bond yields enabled Gold to stage a nice comeback of 1.11% after yesterday’s drubbing, but it was not enough to reclaim the $1,900 level.

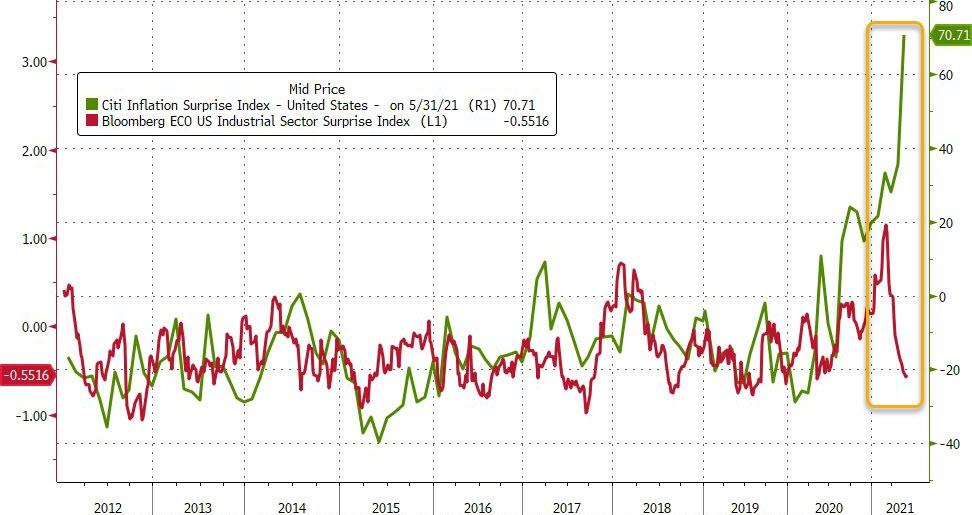
I have talked about the potential of moving back into a stagflation scenario like what we saw in the late 70s. Some indicators are out of whack and support this possibility.

ZeroHedge, via Bloomberg, posted this chart while pondering the question “which way will the jaws snap shut?”

Read More
Weekly StatSheet For The ETF Tracker Newsletter – Updated Through 06/03/2021

Ulli ETF StatSheet Contact

ETF Data updated through Thursday, June 3, 2021

Methodology/Use of this StatSheet:

1. From the universe of over 1,800 ETFs, I have selected only those with a trading volume of over $5 million per day (HV ETFs), so that liquidity and a small bid/ask spread are assured.

2. Trend Tracking Indexes (TTIs)

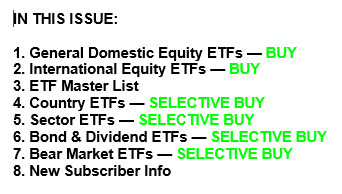
Buy or Sell decisions for Domestic and International ETFs (section 1 and 2), are made based on the respective TTI and its position either above or below its long-term M/A (Moving Average). A crossing of the trend line from below accompanied by some staying power above constitutes a “Buy” signal. Conversely, a clear break below the line constitutes a “Sell” signal. Additionally, I use an 8% trailing stop loss on all positions in these categories to control downside risk.

3. All other investment arenas do not have a TTI and should be traded based on the position of the individual ETF relative to its own respective trend line (%M/A). That’s why those signals are referred to as a “Selective Buy.” In other words, if an ETF crosses its own trendline to the upside, a “Buy” signal is generated. Since these areas tend to be more volatile, I recommend a wider trailing sell stop of 8%-10% depending on your risk tolerance.

If you are unfamiliar with some of the terminology, please see Glossary of Terms and new subscriber information in section 9.     

1. DOMESTIC EQUITY ETFs: BUY — since 07/22/2020

Click on chart to enlarge

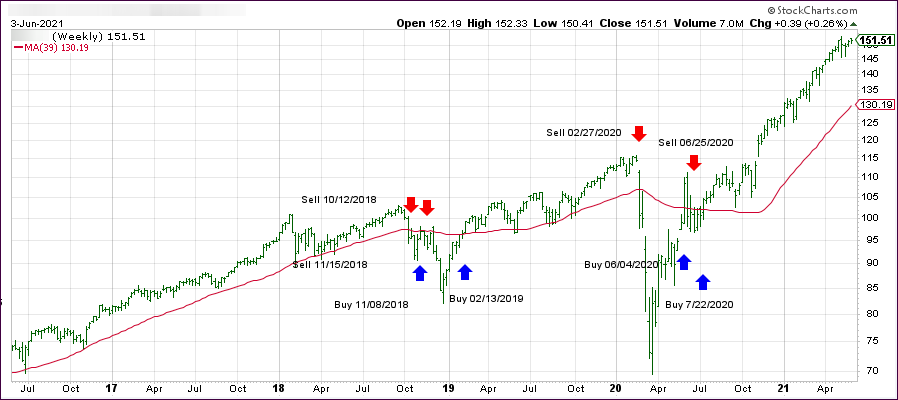
Our main directional indicator, the Domestic Trend Tracking Index (TTI-green line in the above chart) has now rallied above its long-term trend line (red) by +17.34% and remains in “BUY” mode as posted.

Read More

No Market Commentary

Ulli Uncategorized Contact

Due to some business commitments, I will not be able to write today’s commentary. Regular posting will resume tomorrow..

Ulli…

Thriving And Diving

Ulli Market Commentary Contact

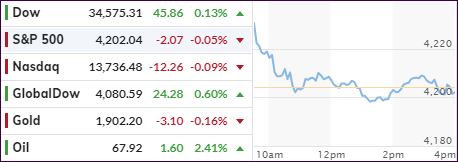
[Chart courtesy of MarketWatch.com]

  1. Moving the markets

In a repeat performance from yesterday, the major indexes rocketed higher right after the opening but then lost their mojo, headed below their respective unchanged lines but managed to eke out a small gain.

The S&P 500 hovers less than 1% from its record high in May and is having trouble breaking through that glass ceiling. The Dow and Nasdaq are also positioned within striking distance of their record levels with the former needing a 1.5% rally, while the latter has some 3.5% to go before reaching that lofty point.

Inflation fears and the uneven economic reopening seem to be keeping a lid on further advances, as is Friday’s upcoming big jobs report. After last month’s disaster, expectations are for 671k new nonfarm payrolls, considerably higher than April’s 266k, for which the whisper number was close to 1 million.

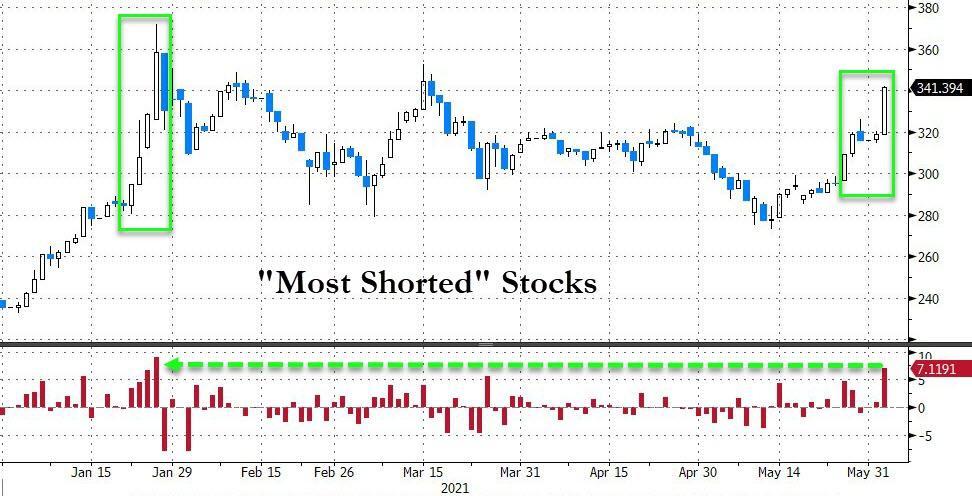
The most shorted stocks were subjected to an epic squeeze, their biggest since the chaos with GME in January, according to ZeroHedge. Small Caps rode another roller coaster and ended slightly in the red (VBK), while “value” again outperformed “growth.”

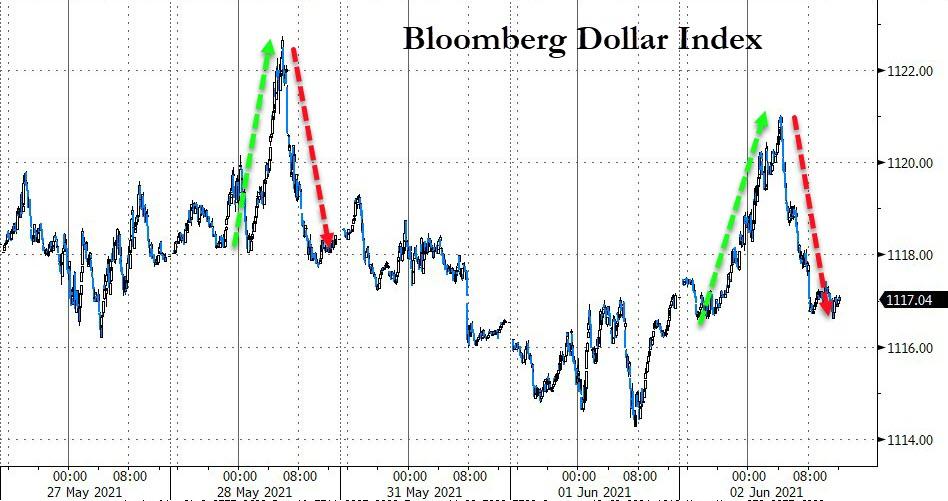
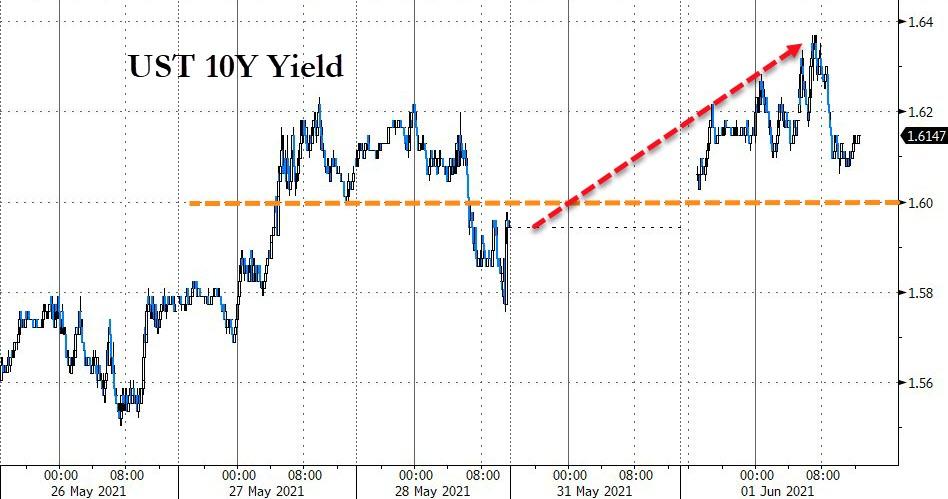
The US Dollar index was stuck in a world of its own with an early rip followed by a mid-day dip back to the unchanged line. Bond yields slid with the 10-year slipping to the 1.59% area. This allowed Gold to rise moderately and solidly its position above its recently conquered $1,900 level.

I expect more of the same tomorrow with trader’s being focused on Friday’s jobs report.

Read More

Aimless Wandering

Ulli Market Commentary Contact

[Chart courtesy of MarketWatch.com]

  1. Moving the markets

Despite a bullish start to open the first day of trading in June, the major indexes lost their early upward momentum throughout the day. The S&P 500 and Nasdaq dropped below their respective unchanged lines, bounced back, but still ended up slightly in the red, while the Dow stayed in the green.

In the end, the indexes closed just about unchanged. Two forces were engaged in a tug-of-war, namely optimism about the continued economic reopening, which was challenged by increased fears about price pressures because of spreading inflation.

At least for the day, the latter won this tug-of-war with “value” again winning the battle against the “growth” sector. The broad S&P 500 value ETF (RPV) scored a respectable +1.04%, and the Small Cap Value ETF IJS did even better by adding a rock-solid +1.94%.

According to CNBC, concerns about supply shortages remain front and center, and may have unintended consequences:

Despite the better coronavirus figures, investors remain on edge about the potential for a sustained and marked move higher in inflation. Higher prices the result of supply shortages and recovering demand could force the Federal Reserve to hike interest rates and curb asset purchases sooner.

Bond yields were higher and back above the 1.61% level for the 10-year. The US Dollar went south, but that drop was not enough for Gold to overcome rising bond yields. As a result, the precious metal trod water, vacillated around its unchanged line, yet successfully managed to defend its $1,900 level.

Not much was gained or lost on this first day of June, but if you were exposed to “value” ETFs, you have something to smile about.

Read More

ETFs On The Cutline – Updated Through 05/28/2021

Ulli ETFs on the Cutline Contact

Below, please find the latest High-Volume ETF Cutline report, which shows how far above or below their respective long-term trend lines (39-week SMA) my currently tracked ETFs are positioned.

This report covers the HV ETF Master List from Thursday’s StatSheet and includes 312 High Volume ETFs, defined as those with an average daily volume of more than $5 million, of which currently 256 (last week 254) are hovering in bullish territory. The yellow line separates those ETFs that are positioned above their trend line (%M/A) from those that have dropped below it.

Take a look:                                                                   

The HV ETF Master Cutline Report

In case you are not familiar with some of the terminology used in the reports, please read the Glossary of Terms. If you missed the original post about the Cutline approach, you can read it here.