
- Moving the markets
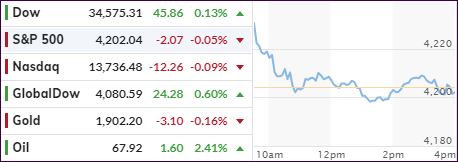
Despite a bullish start to open the first day of trading in June, the major indexes lost their early upward momentum throughout the day. The S&P 500 and Nasdaq dropped below their respective unchanged lines, bounced back, but still ended up slightly in the red, while the Dow stayed in the green.
In the end, the indexes closed just about unchanged. Two forces were engaged in a tug-of-war, namely optimism about the continued economic reopening, which was challenged by increased fears about price pressures because of spreading inflation.
At least for the day, the latter won this tug-of-war with “value” again winning the battle against the “growth” sector. The broad S&P 500 value ETF (RPV) scored a respectable +1.04%, and the Small Cap Value ETF IJS did even better by adding a rock-solid +1.94%.
According to CNBC, concerns about supply shortages remain front and center, and may have unintended consequences:
Despite the better coronavirus figures, investors remain on edge about the potential for a sustained and marked move higher in inflation. Higher prices the result of supply shortages and recovering demand could force the Federal Reserve to hike interest rates and curb asset purchases sooner.
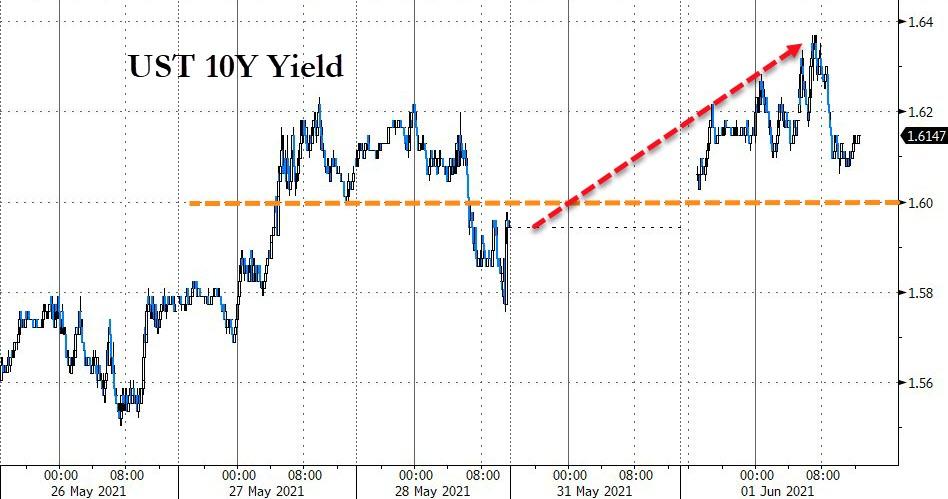
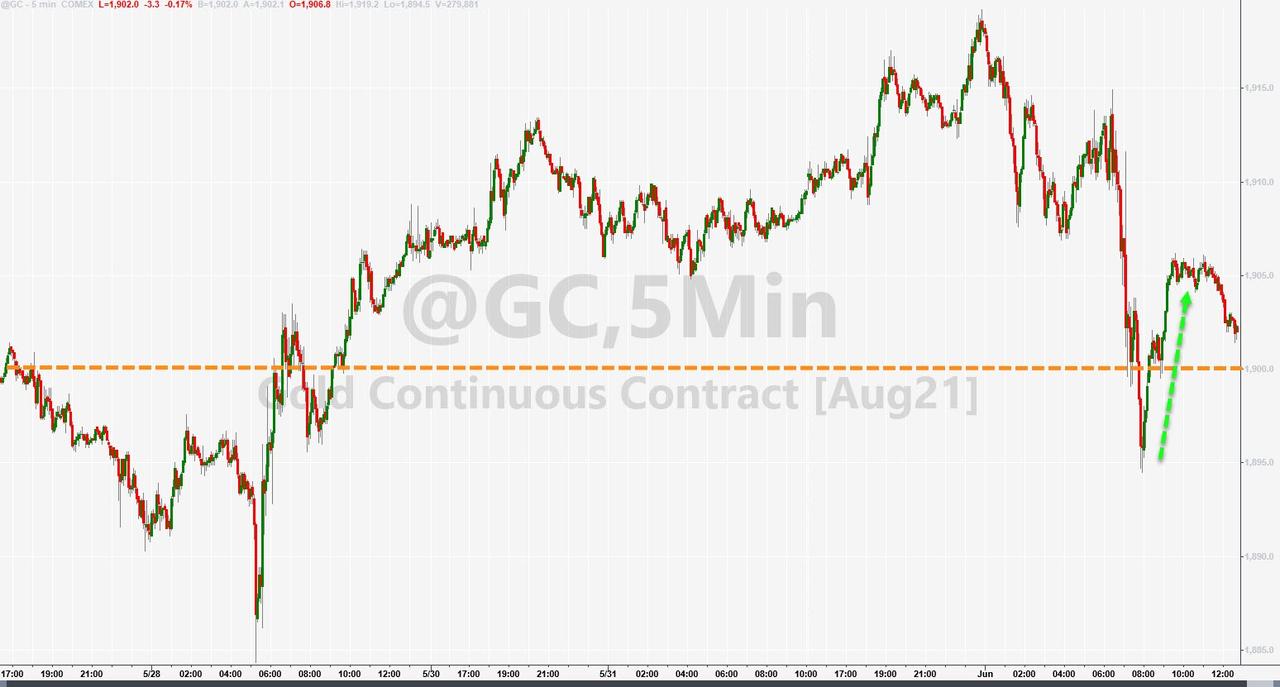
Bond yields were higher and back above the 1.61% level for the 10-year. The US Dollar went south, but that drop was not enough for Gold to overcome rising bond yields. As a result, the precious metal trod water, vacillated around its unchanged line, yet successfully managed to defend its $1,900 level.
Not much was gained or lost on this first day of June, but if you were exposed to “value” ETFs, you have something to smile about.
2. ETFs in the Spotlight
In case you missed the announcement and description of this section, you can read it here again.
It features some of the 10 broadly diversified domestic and sector ETFs from my HighVolume list as posted every Saturday. Furthermore, they are screened for the lowest MaxDD% number meaning they have been showing better resistance to temporary sell offs than all others over the past year.
The below table simply demonstrates the magnitude with which these ETFs are fluctuating above or below their respective individual trend lines (%+/-M/A). A break below, represented by a negative number, shows weakness, while a break above, represented by a positive percentage, shows strength.
For hundreds of ETF choices, be sure to reference Thursday’s StatSheet.
For this current domestic “Buy” cycle, here’s how some our candidates have fared:
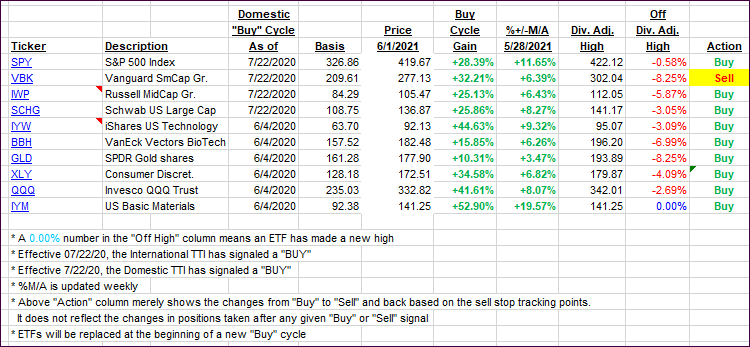
Click image to enlarge.
Again, the %+/-M/A column above shows the position of the various ETFs in relation to their respective long-term trend lines, while the trailing sell stops are being tracked in the “Off High” column. The “Action” column will signal a “Sell” once the -8% point has been taken out in the “Off High” column. For more volatile sector ETFs, the trigger point is -10%.
3. Trend Tracking Indexes (TTIs)
Our TTIs gained a tad, despite the overall market appearing directionless.
This is how we closed 06/01/2021:
Domestic TTI: +17.43% above its M/A (prior close +17.04%)—Buy signal effective 07/22/2020.
International TTI: +15.86% above its M/A (prior close +15.41%)—Buy signals effective 07/22/2020.
Disclosure: I am obliged to inform you that I, as well as my advisory clients, own some of the ETFs listed in the above table. Furthermore, they do not represent a specific investment recommendation for you, they merely show which ETFs from the universe I track are falling within the specified guidelines.
All linked charts above are courtesy of Bloomberg via ZeroHedge.
Contact Ulli