ETF Tracker Newsletter For May 28, 2021

Ulli ETF Tracker Contact

ETF Tracker StatSheet          

You can view the latest version here.

S&P 500 NOTCHES A 4TH STRAIGHT WINNING MONTH
[Chart courtesy of MarketWatch.com]

  1. Moving the markets

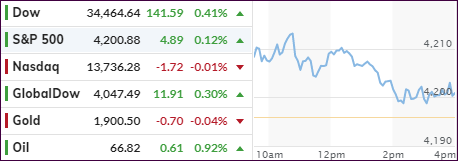
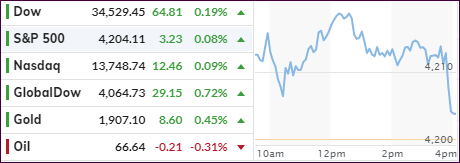
As we’ve seen before, an early bounce hit the skids mid-day and accelerated towards the end, however, the major indexes managed to eke out a green close with the S&P 500 scoring its 4th straight winning month.

For May, the Dow added 1.9%, the S&P 500 gained 0.6% but the Nasdaq was the odd man out and lost 1.5%, which was its first down month in seven.

Inflation continues to be with us, as a key indicator, namely the core personal consumption index, rose 3.1% in April and exceeded expectations of a 2.9% increase. But analysts were quick to point out that this was not as bad as Wall Street had feared, which means that interest rates and bond yields should remain low—at least that’s how the wishful thinking goes.

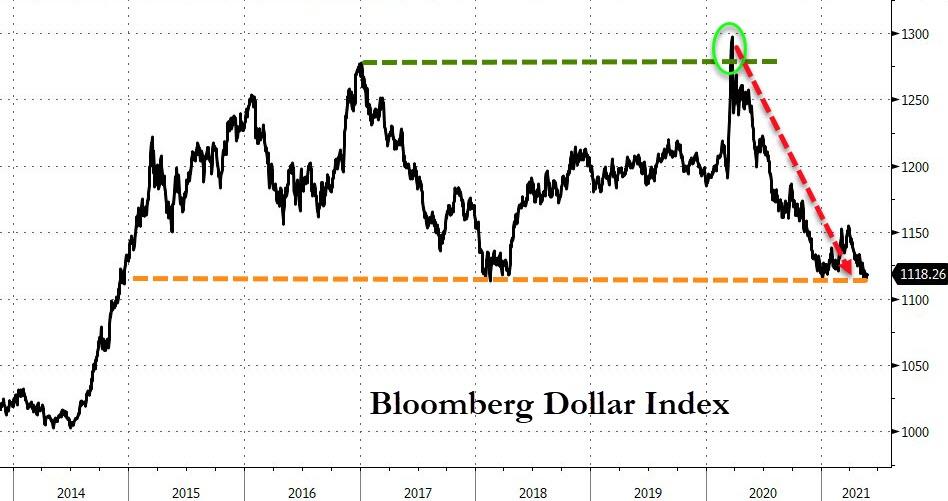
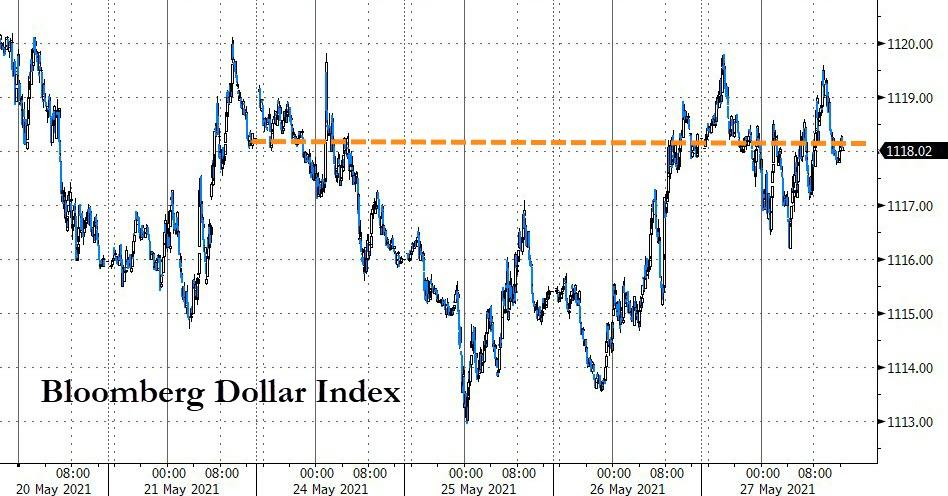
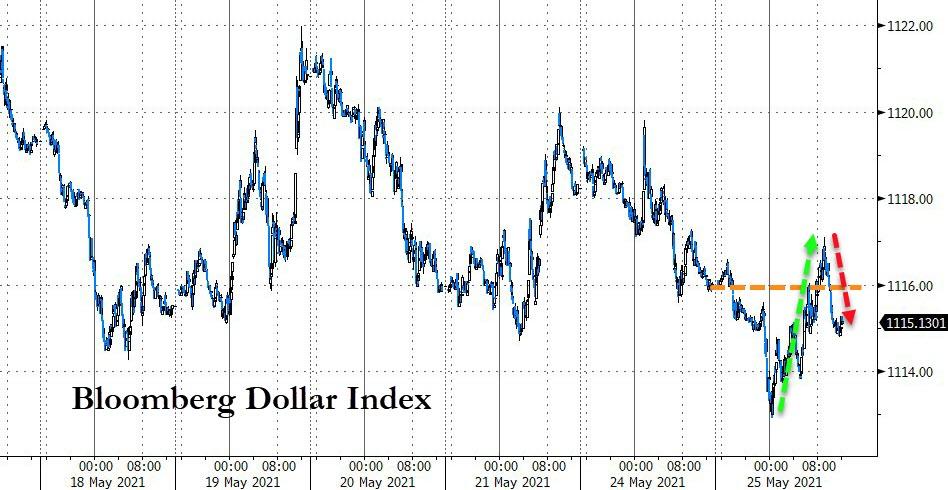
Looking at the big picture, the US Dollar has slumped to its major support level set it 2018, and it remains to be seen if the bears will continue to have it their way. If Gold’s recent advance of over 7.5% in May is any indication, the dollar may very well visit its next support level set in 2014.

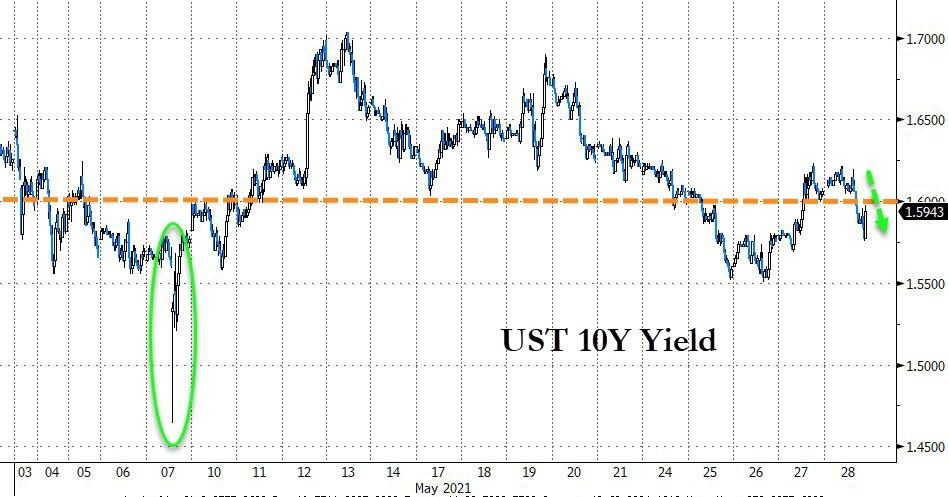
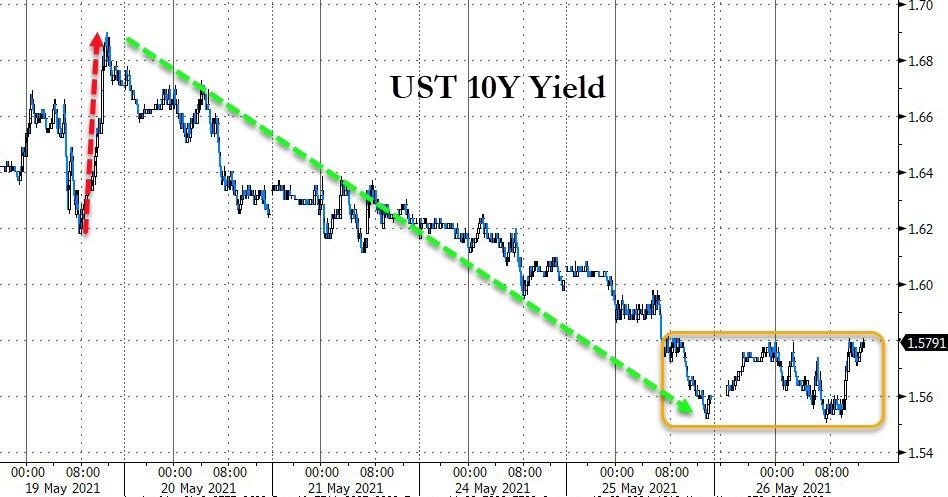
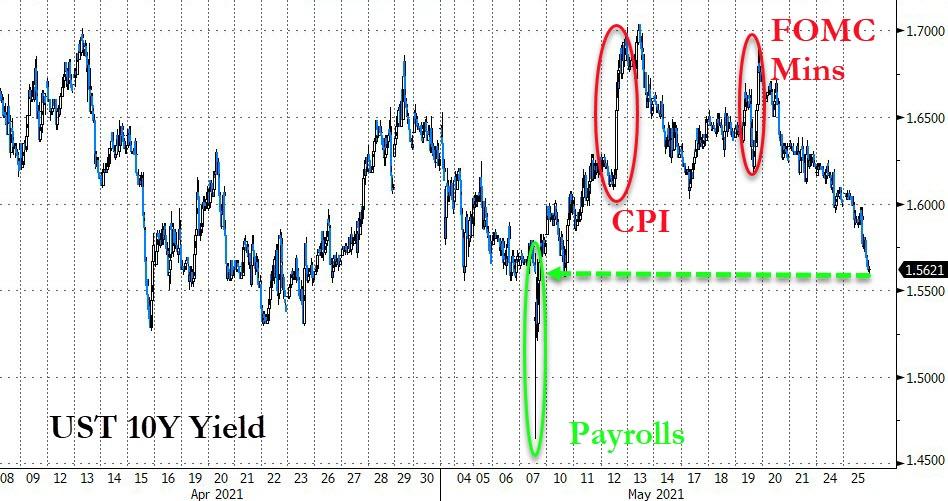
During the month, the 10-year bond yield raced from a low of 1.46% all the way to 1.7% and settled at the higher end of the range—just below 1.60%.

As mentioned above, Gold performed very well in May, which clearly confirms that, despite officialdom jawboning to the contrary, inflation is here to stay and may get worse. It should be clear to anyone that inflation cannot be simply turned on and off at will, just like you can’t push the toothpaste back into the tube.

Despite the much touted and discussed Fed toolbox, they really are limited to one major option, which is eventually to sharply hike interest rates a la 1980, should the problem get out of hand.  

If that measure is enacted, you can kiss the bond-, stock- and housing markets goodbye.   

Read More
Weekly StatSheet For The ETF Tracker Newsletter – Updated Through 05/27/2021

Ulli ETF StatSheet Contact

ETF Data updated through Thursday, May 27, 2021

Methodology/Use of this StatSheet:

1. From the universe of over 1,800 ETFs, I have selected only those with a trading volume of over $5 million per day (HV ETFs), so that liquidity and a small bid/ask spread are assured.

2. Trend Tracking Indexes (TTIs)

Buy or Sell decisions for Domestic and International ETFs (section 1 and 2), are made based on the respective TTI and its position either above or below its long-term M/A (Moving Average). A crossing of the trend line from below accompanied by some staying power above constitutes a “Buy” signal. Conversely, a clear break below the line constitutes a “Sell” signal. Additionally, I use an 8% trailing stop loss on all positions in these categories to control downside risk.

3. All other investment arenas do not have a TTI and should be traded based on the position of the individual ETF relative to its own respective trend line (%M/A). That’s why those signals are referred to as a “Selective Buy.” In other words, if an ETF crosses its own trendline to the upside, a “Buy” signal is generated. Since these areas tend to be more volatile, I recommend a wider trailing sell stop of 8%-10% depending on your risk tolerance.

If you are unfamiliar with some of the terminology, please see Glossary of Terms and new subscriber information in section 9.     

1. DOMESTIC EQUITY ETFs: BUY — since 07/22/2020

Click on chart to enlarge

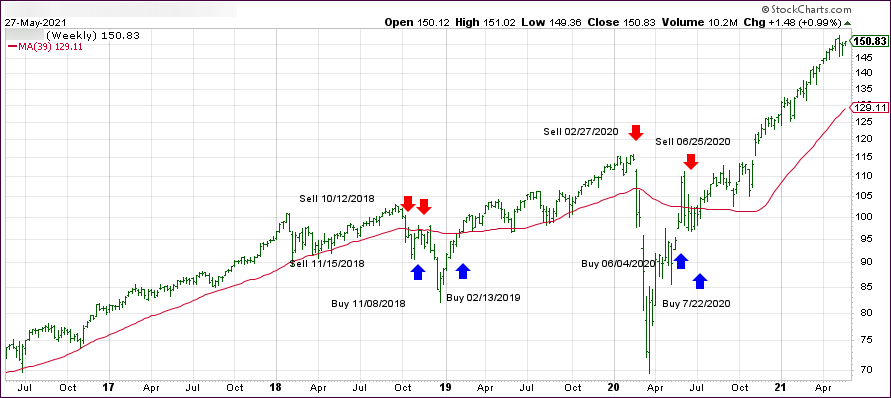
Our main directional indicator, the Domestic Trend Tracking Index (TTI-green line in the above chart) has now rallied above its long-term trend line (red) by +17.75% and remains in “BUY” mode as posted.

Read More

Battling For Altitude

Ulli Market Commentary Contact

[Chart courtesy of MarketWatch.com]

  1. Moving the markets

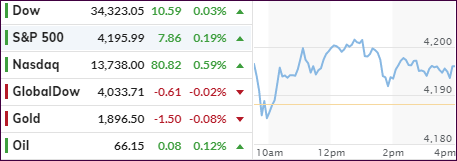
After an early rally, the major indexes spent the remainder of the session struggling to maintain their gains but were not able to with prices slipping and the Nasdaq dipping into the red. However, the Dow and S&P 500 were able to advance modestly.

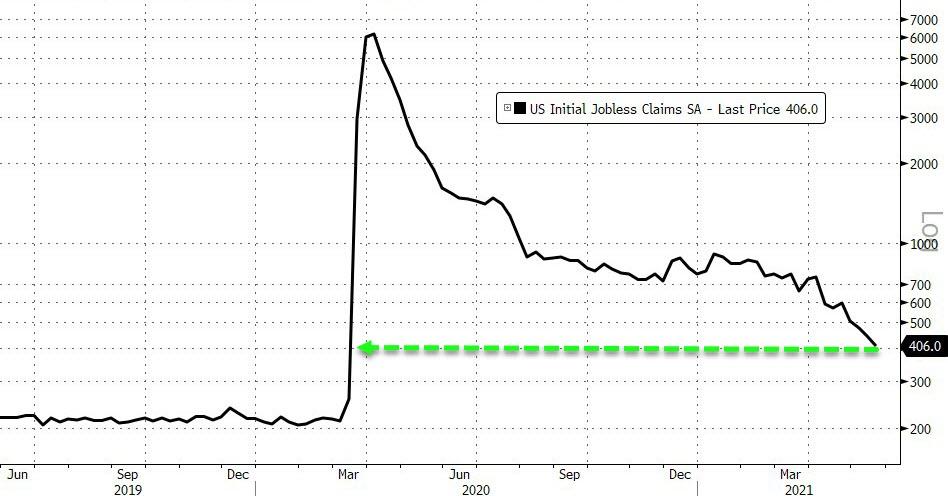
Better-than-expected Initial Jobless Claims provided the ammunition for the early surge. The Labor Department reported that these claims had tumbled to their lowest since the lockdown began, as “only” 406k Americans filed vs. 425k expected.

But, as ZeroHedge pointed out, that is still double the pre-pandemic norms and, despite this improvement, almost 16 million Americans area still on some form of government dole.

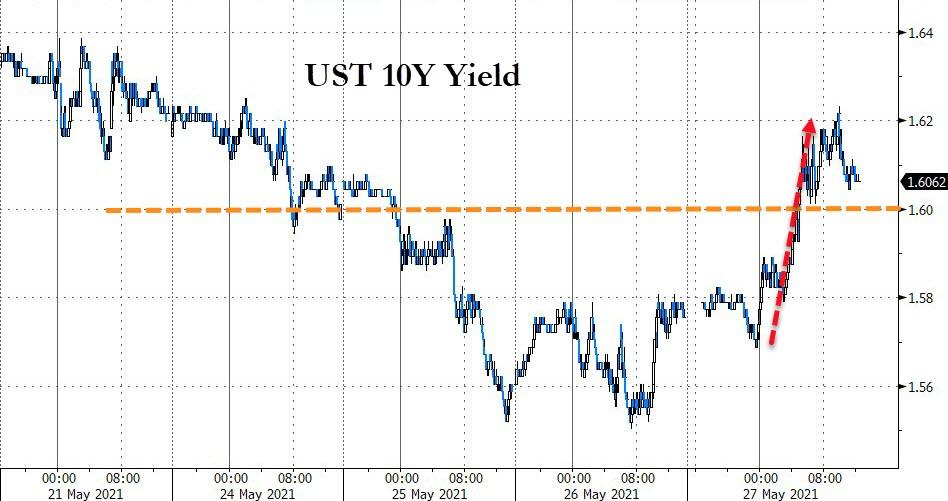
As news of Biden’s enormous budget hit the wires, bond yields spiked and stocks started to retreat, except Small Caps, which remained solidly in the green. So did the value ETF RPV, which had a strong showing of +1.22%, thereby clearly outperforming the “growth” sector.

The US Dollar index rode the rollercoaster and ended just about unchanged, while the Gold ETF GLD managed to eke out a tiny gain in the face of rising bond yields.

For sure, we saw a slowdown in trading and volatility ahead of the long Memorial Day weekend. I expect more of that tomorrow with traders’ enthusiasm to bid up stocks ahead of a Holiday not being their priority number one.  

Read More

Clinging To The Unchanged Line

Ulli Market Commentary Contact

[Chart courtesy of MarketWatch.com]

  1. Moving the markets

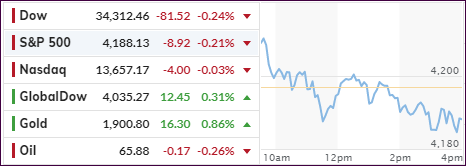
Despite an early bounce, much of the gains were given back during the session with only the Nasdaq staying solidly in the green, while the other two major indexes clung to their respective unchanged lines.

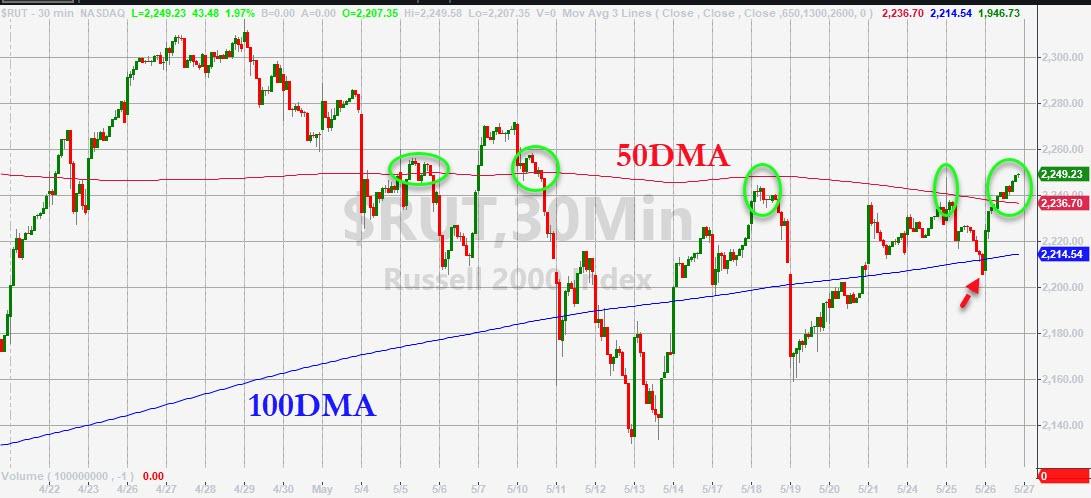
The theme remained the same as those stocks, which are closely connected to the economic reopening, benefitted the most. That helped the tech sector and especially Small Caps to gain some footing, after the latter had been sliding ever since making an ATH the middle of February.  

A positive outlook about the economy continues to be the center of discussion, with CNBC adding:

The optimism on the economy comes as U.S. average daily Covid cases fall below 25,000 and as nearly half the U.S. population has received at least one vaccination dose.

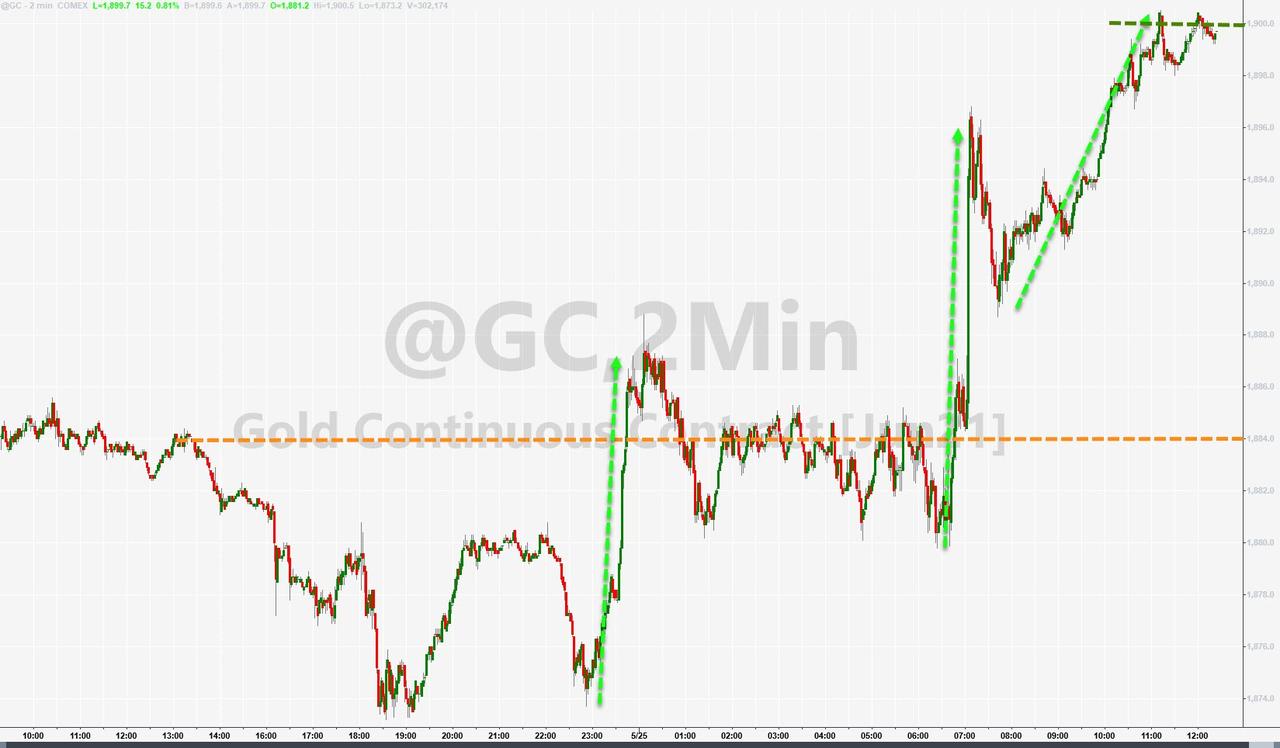
Bond yields went mostly sideways but edged a tad higher into the close, which was followed by the US Dollar index finally finding a reason to rally. That combination took the starch out of an early surge in Gold, with the precious metal surrendering its $1,900 level by a small margin.

It was a session where not much was lost and not much was gained. To me, it seems like another driver will be needed to push the major indexes higher.  

Read More

Signs Of Fatigue

Ulli Market Commentary Contact

[Chart courtesy of MarketWatch.com]

  1. Moving the markets

An early rally bit the dust, with the major indexes not being able to sustain the initial bullish momentum. The losses were small, less than 0.25%, and the Nasdaq ended just about unchanged.

Amazon came under pressure after a DC attorney launching a lawsuit on antitrust grounds, which, by affiliation, affected the entire tech sector. Airlines and cruise lines gave an assist and kept the broader market from sliding further.

Small Caps rode the rollercoaster today being up 1% at the onset and down 1.57% (IJS) at the close, thereby ending up worse than the major indexes.

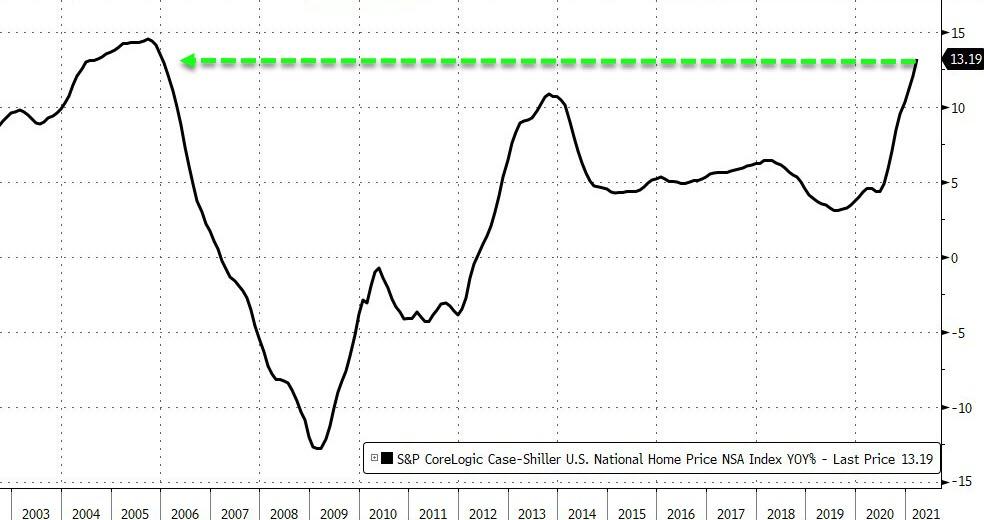
On the economic side, New Home Sales plunged, after a massive downward revision for March (from 20.7% to only 7.4%), with April showing a drop of 5.9% MoM. At the same time, US Home Prices exploded by rising 13.19% YoY, the fastest since 2005, according to ZeroHedge.

The US Dollar pumped and dumped and closed slightly lower. The 10-year bond yield retreated as well, thereby giving Gold a reason to rally, and the precious metal added not only +0.84% but also reclaimed its $1,900 level—although by only a small margin.

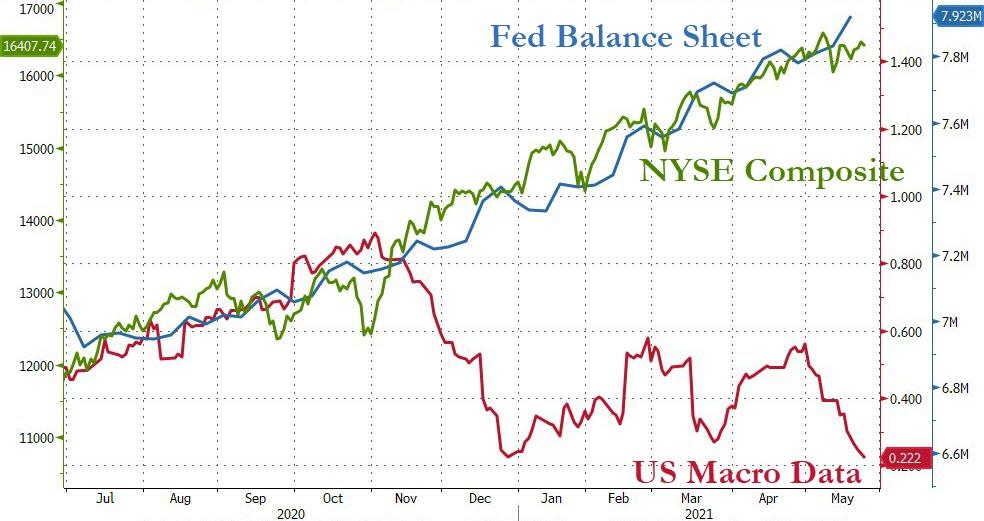
The Fed’s balance sheet keeps growing and remains the primary reason for equities to hover at these elevated levels, as this chart by Bloomberg clearly shows, while US Macro Data are heading in the opposite direction.

Read More

Recapturing Upward Momentum

Ulli Market Commentary Contact

[Chart courtesy of MarketWatch.com]

  1. Moving the markets

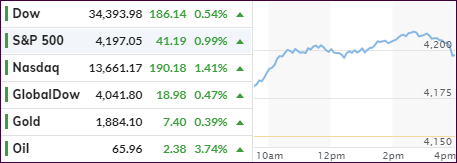
Right after the opening bell, the bulls took charge, after having lost the momentum battle last week, with the major indexes climbing solidly led by the embattled tech sector. Positive news about the continued economic reopening provided the ammunition for the Nasdaq to advance solidly after the recent spanking.

Throughout the session, there was no hesitancy as to market direction with minor pullbacks being quickly bought, as this week got off to a good start. I guess traders were re-thinking the Fed’s hawkish FOMC minutes from last week and decided that “buying the dip” was the way to go, a mentality that has provided support throughout this year and prevented corrections from becoming more serious.

So far, only the Dow is on track to score a gain for May, while the S&P 500 may snap its three-month winning streak. The Nasdaq, which is still down some 3% for the month, may finally break its 6-month winning streak. But there are still four trading days left…

With the US Dollar Index down, and 10-year bond yield retreating, Gold was the beneficiary again by gaining 0.33%.

With tech taking the lead for the day, the S&P 500 (SPY) outperformed its “value” cousin RPV by a good spread, yet on a YTD basis, the latter is ahead by a huge margin, namely +31% vs. 12.5%.

Read More